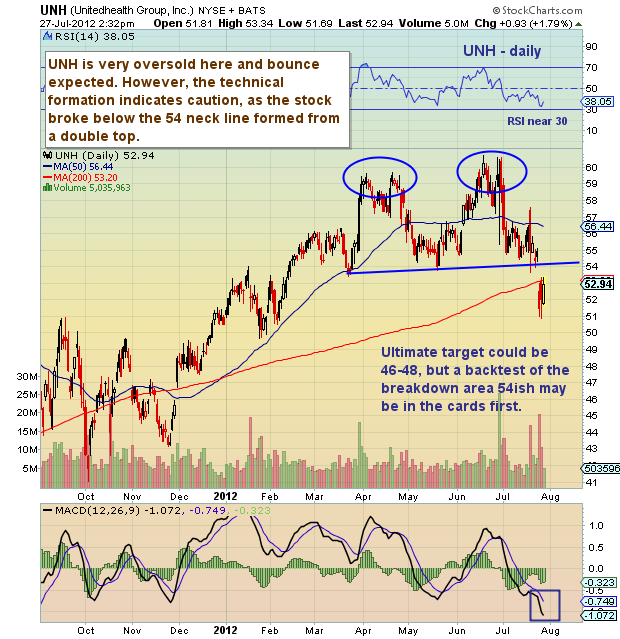
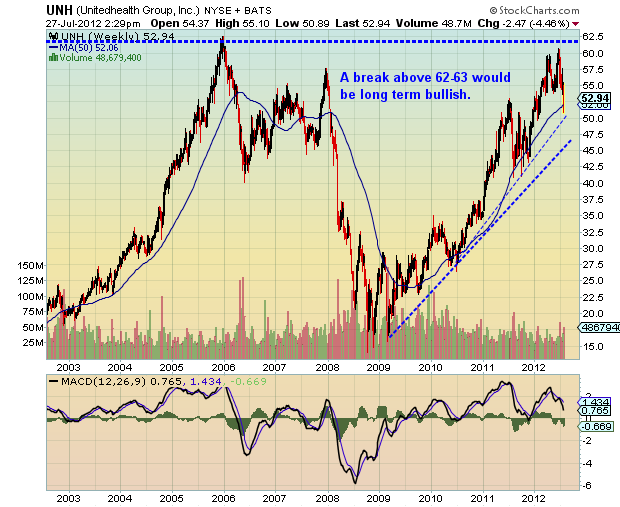
 After touching up near all time highs around 60 dollar resistance, Unitedhealth Group (UNH) stock took a breather. It’s multi-year run has been quite impressive, but moves like this need a break, so this shouldn’t be a surprise. But if the stock is to continue its left to right upward pattern, it will likely need to hold above 46 with this pullback/consolidation move.
All things considered, it was a likely spot for a pullback (see long term weekly chart below). But the take away is that investors should have become cautious when the stock failed for a second time around 60 dollars and started to head lower (see double top formation in daily chart). Furthermore, the break below the neckline was the trigger for the selloff, which now targets 47ish. But do note that the stock is very oversold here and a reflex rally (bounce) is likely.
Unitedhealth Group (UNH) stock charts with price support and resistance levels and technical analysis as of July 27, 2012. UNH double top technical pattern breakdown. UNH stock with important price support levels and targets.
———————————————————
Twitter: @andrewnyquist and @seeitmarket Facebook: See It Market
No position in any of the securities mentioned at the time of publication.
Any opinions expressed herein are solely those of the author, and do not in any way represent the views or opinions of his employer or any other person or entity.


