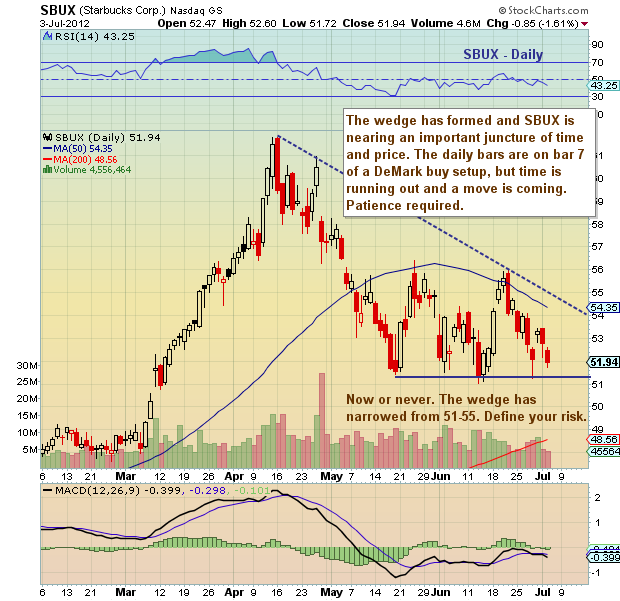
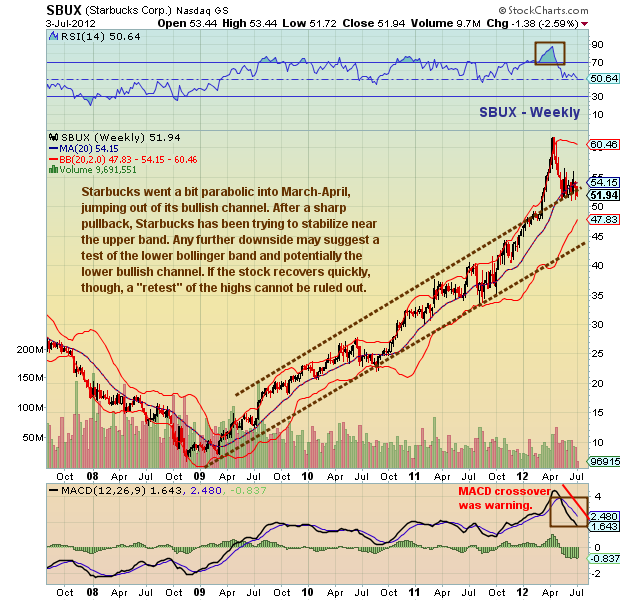
Starbucks (SBUX) is hanging out in a wedge pattern near the upper band of a three year channel. Keep an eye on price action over the next week, as the daily chart is on bar 7 of a buy setup… but time and price say time is running out for a rally. If the stock cannot rally over the next week, then 47-48 may be likely first target (lower bollinger band and 200 dma).
Starbucks (SBUX) stock price chart with support and resistance levels as of July 3, 2012. Starbucks stock ticker SBUX.
———————————————————
Twitter: @andrewnyquist and @seeitmarket Facebook: See It Market
No position in any of the securities mentioned at the time of publication.
Any opinions expressed herein are solely those of the author, and do not in any way represent the views or opinions of his employer or any other person or entity.


