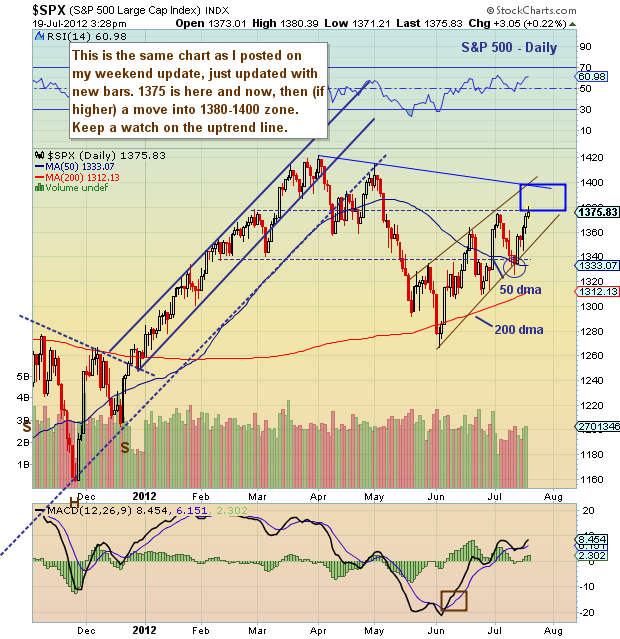
 Since the S&P 500 price structure and targets are nearly the same as the last update, I am merely posting the chart with new daily bars. Today we closed above 1375 and are now “in” the blue box short term price target zone. High end is 1400-1405.
As always, define risk and watch the uptrend. I’ll provide a full weekend update tomorrow.
S&P 500 stock market chart with technical analysis overlay as of July 19, 2012. Price support and resistance levels and stock market analysis. S&P 500 retesting the highs.
———————————————————
Twitter: @andrewnyquist and @seeitmarket Facebook: See It Market
No position in any of the securities mentioned at the time of publication.
Any opinions expressed herein are solely those of the author, and do not in any way represent the views or opinions of his employer or any other person or entity.


