By Andrew Nyquist
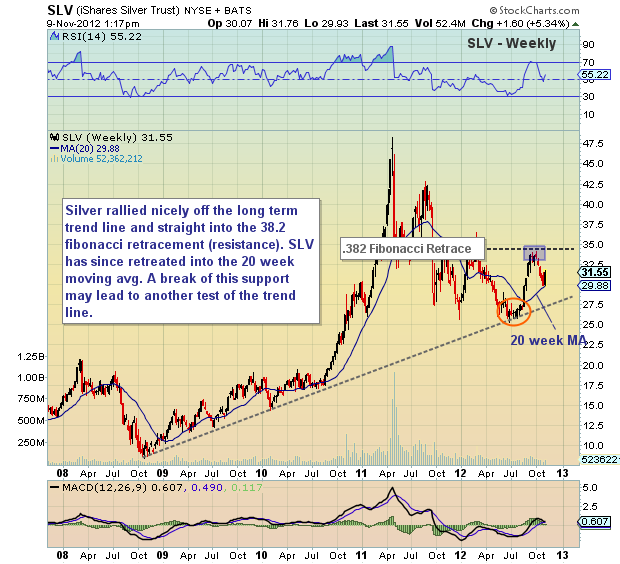
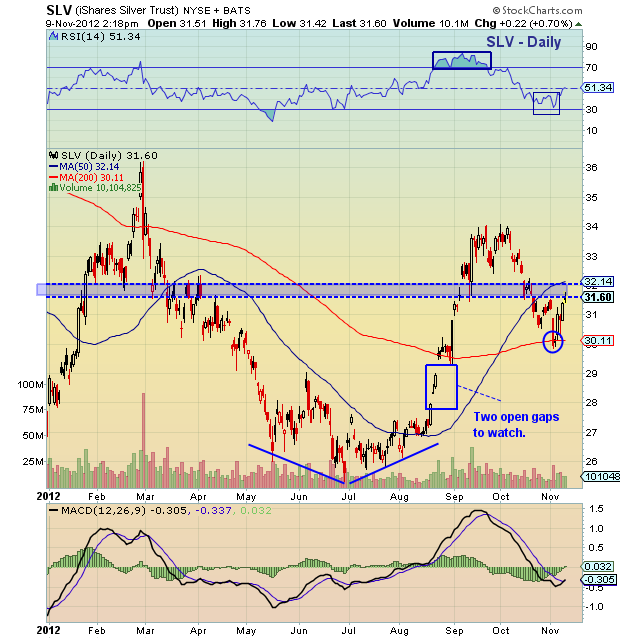
Quick update on Silver (SLV). This week saw a nice bounce off the 20 day moving average (noted last week). That said, the precious metal is still heavy and will need more than one week to prove that it has stabilized. Also watch congestion (resistance) on daily chart – see below.
Continue to watch the 20 week moving average. Look for another date with the long term trend line if this support gives way.
Trade safe, trade disciplined.
More charts found here.
Silver (SLV) technical charts as of Novemeber 9, 2012. SLV charts with technical analysis and price targets for November. Precious metals sector and silver.
———————————————————
Twitter: @andrewnyquist and @seeitmarket Facebook: See It Market
No position in any of the securities mentioned at the time of publication.
Any opinions expressed herein are solely those of the author, and do not in any way represent the views or opinions of his employer or any other person or entity.


