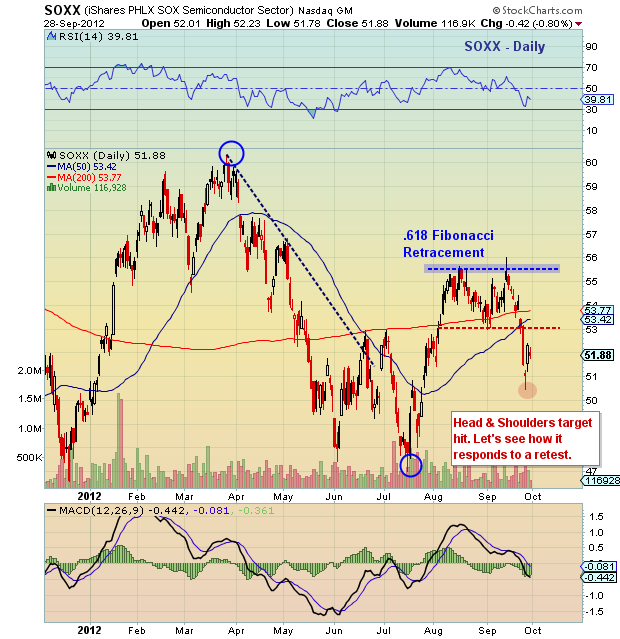
 It’s amazing how well fibonacci retracements work as a general area of magnetic support or resistance. Case in point the Semiconductor Sector (SOXX). The .618 fibonacci retracement of the March to July drop has proven to be stiff resistance. The latest run at the level formed a head and shoulders that dropped the index hard.
But, the target price out of that formation has been hit and a bounce has ensued. This could set up for a nice low risk / high reward trade IF the recent lows hold. The retest here will be crucial. Watch for relative strength (i.e. outperformance of other tech components), especially if the market is soft early next week. Careful though, as the index is still weak and has much to prove. This is why using stops is a must.
Trade safe, trade disciplined.
Previous SOXX Chartology here.
More Charts here.
Semiconductor Sector index (SOXX) chart with technical support and resistance as of September 25, 2012. SOXX Fibonacci retracement levels. SOXX technical analysis.
———————————————————
Twitter: @andrewnyquist and @seeitmarket Facebook: See It Market
No position in any of the securities mentioned at the time of publication.
Any opinions expressed herein are solely those of the author, and do not in any way represent the views or opinions of his employer or any other person or entity.


