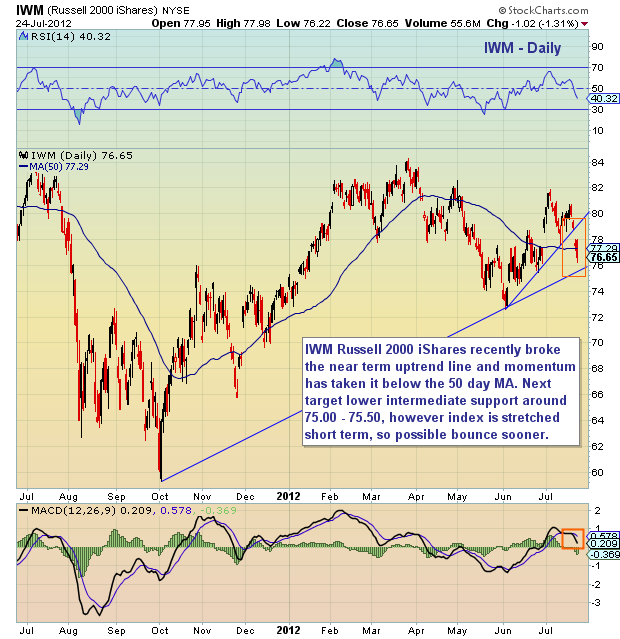
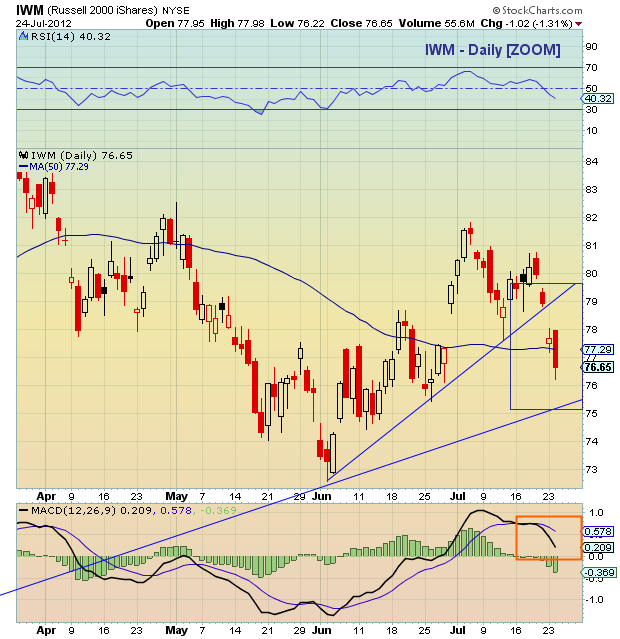
 The Russell 200o iShares (IWM) broke its near-term uptrend line, eliciting a big drop and leading the major indices lower. Support resides at the intermediate uptrend support around 75.00 to 75.50.
A reflex rally/bounce is approaching, but note that the index will likely need to retake the 50 day MA (and hold it) if it has any hopes of repairing the technical damage over the short term.
Russell 2000 iShares (IWM) stock charts with technical analysis overlay as of July 24, 2012. Price support and resistance levels and stock market analysis. IWM technical support levels.
———————————————————
Twitter: @andrewnyquist and @seeitmarket Facebook: See It Market
No position in any of the securities mentioned at the time of publication.
Any opinions expressed herein are solely those of the author, and do not in any way represent the views or opinions of his employer or any other person or entity.


