 By Andrew Nyquist
The Nasdaq 100 (NDX) has been running for a while. In fact, running so fast that I’m getting tired thinking about it. The past 6 months have felt more like a sprint than a marathon. And, of course, some of this has to do with Apple (AAPL) +60% gains (equal to a smooth addition of roughly $220BB in market cap in just 6 months!).
Regardless, tech is hot and target prices keep rising, rising, rising. It’s that old adage: the trend is your friend.
BUT, if a stock or index separates itself significantly from the trend line, how is one to know when to start employing tighter risk management and raising cash? After all, all bursts higher eventually need to pause and refresh (5-7 percent consolidation). And some pauses need a bit longer to refresh than others (correction/bear).
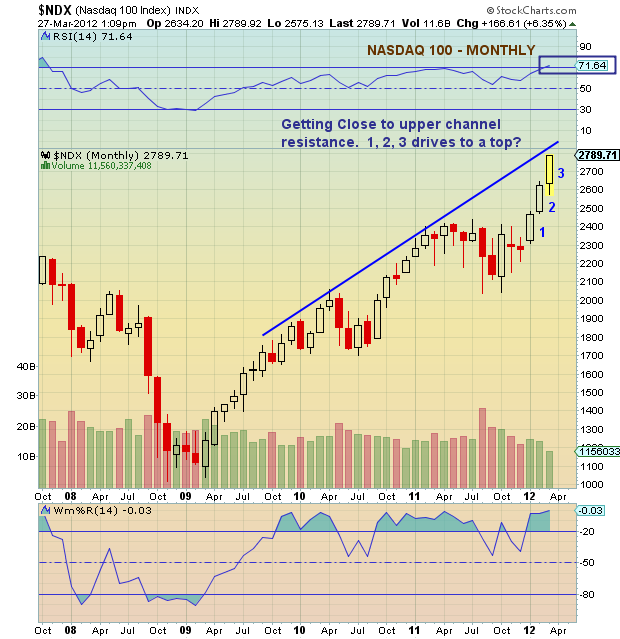
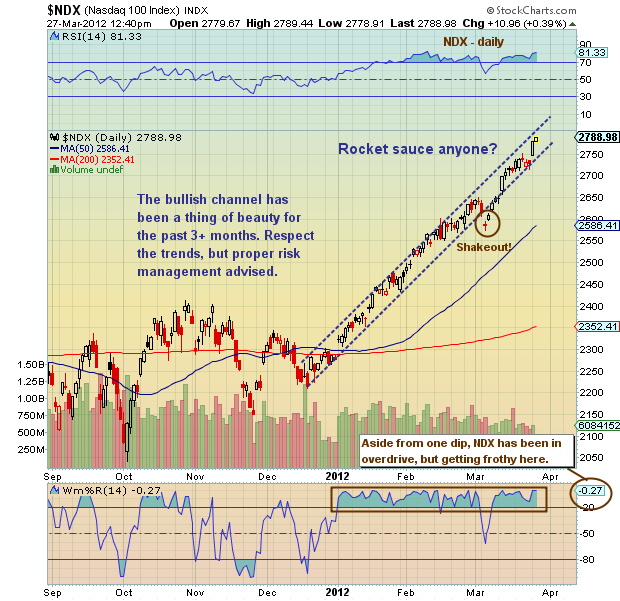
One such way to manage risk when this sort of separation occurs is by watching the upper channel trend resistance. Although many stocks or indices can ride this for a while, quick bursts are often met with some selling, especially on longer timeframes.
On both the daily and monthly charts below, The Nasdaq 100 is closing in on upper channel resistance. Both are important to monitor and both relate to one another. Here’s why.  The monthly chart tells us longer term that anything over 2800 is in and around resistance (so we’re almost there), while the daily chart and its nice tight 3 month channel serve as the near term “tell” or confirmation if you will — IF the lower channel support line (uptrend line) breaks down, then this move is likely to end. Doesn’t mean the bull market is over, but that this thrust needs to pause and refresh.
———————————————————
Your comments and emails are welcome. Readers can contact me directly at andrew@seeitmarket.com.
Twitter: @andrewnyquist and @seeitmarket Facebook: See It Market
Position in NDX related short index fund PSQ.
Any opinions expressed herein are solely those of the author, and do not in any way represent the views or opinions of his employer or any other person or entity.


