**Other technical stock charts found here.
Tagged and searchable under “chartology.”
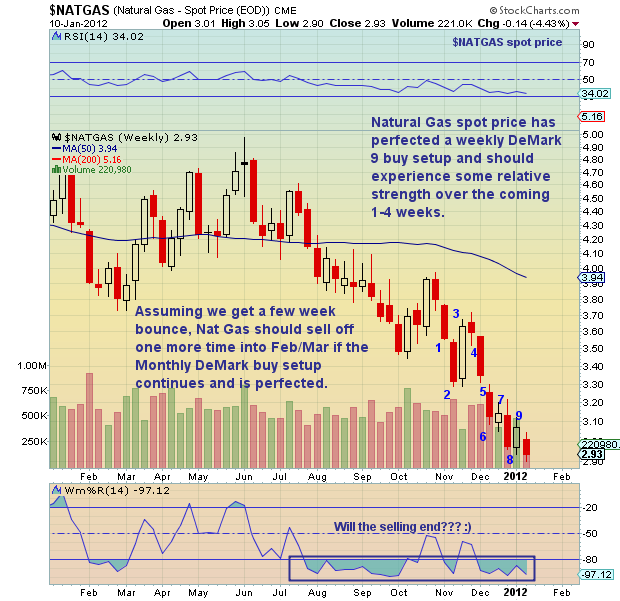
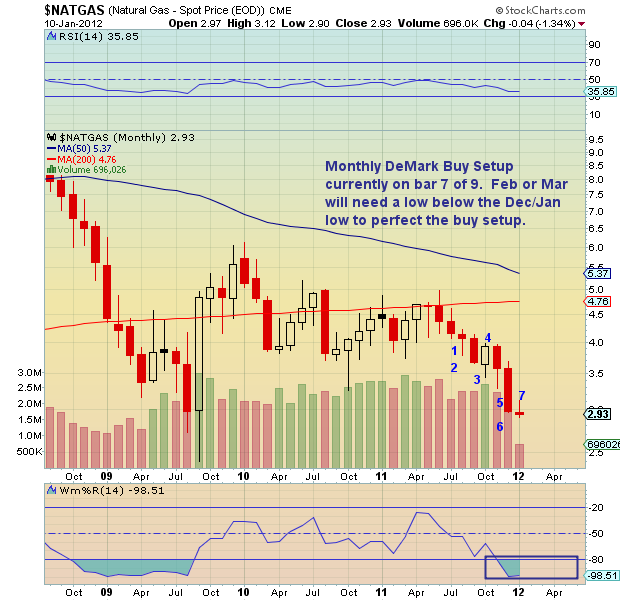
Natural Gas spot price annotated daily stock chart with technical analysis overlay as of January 11, 2012. Price Support and Resistance with Trendlines. Demark analysis, Long Term Investment?
———————————————————
Your comments and emails are welcome. Readers can contact me directly at andrew@seeitmarket.com or follow me on Twitter on @andrewnyquist. For current news and updates, be sure to “Like” See It Market on Facebook. Thank you.
No positions in any of the mentioned securities at time of publication.
Any opinions expressed herein are solely those of the author, and do not in any way represent the views or opinions of his employer or any other person or entity.


