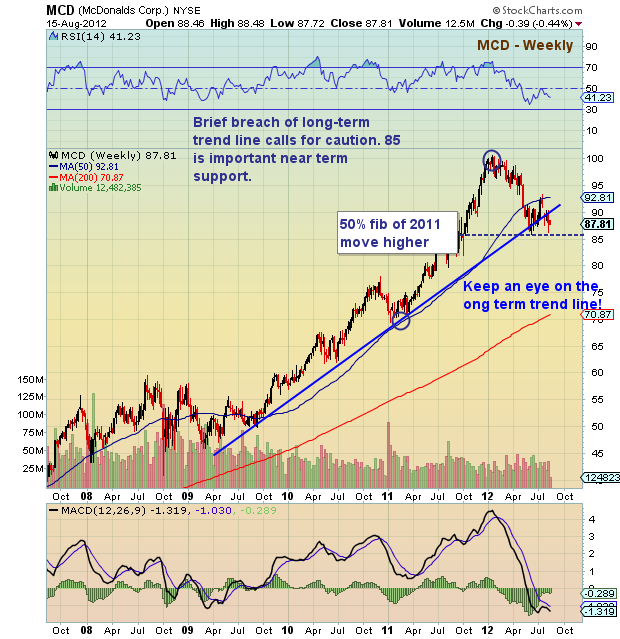
 2012 has been a rough year for McDonalds (MCD) stock. Further, when one considers and compares performance metrics to the overall market YTD, its been brutal.
Over the past two weeks MCD did something it has not done since 2009 – it breached its 3 year trend line. Now, truth be told, a brief breach and recovery (i.e. a shakeout of weak hands) happens. But MCD is two weeks into the breach and needs to recover soon to avoid further technical damage. Either way, 85 will likely need to hold for a rally attempt to take place.
McDonalds (MCD) stock chart with price support and resistance levels. MCD stock chart with technical analysis as of August 15, 2012. MCD long term trend line and support.
———————————————————
Twitter: @andrewnyquist and @seeitmarket Facebook: See It Market
No positions in any of the securities mentioned at the time of publication.
Any opinions expressed herein are solely those of the author, and do not in any way represent the views or opinions of his employer or any other person or entity.


