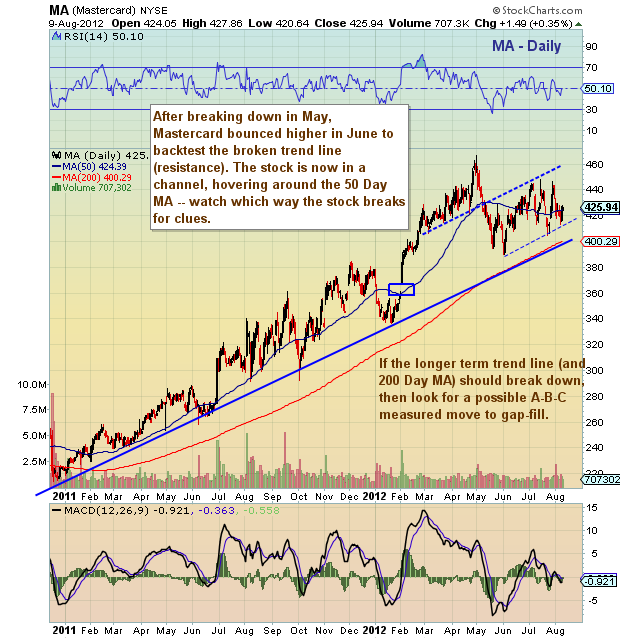
 For the past week or two, Mastercard (MA) has been hanging around the 50 day moving average. Watch the action here and now. A break lower would tee up a pivotal showdown with the 200 day moving average (and longer term trend line). Note that a move below the 200 day moving average would hint at an A-B-C measured move lower to gap fill.
If higher, watch the downtrend line (not shown, but around 440ish), then the back test line and prior highs.
Mastercard (MA) stock chart with technical analysis overlay as of August 9, 2012. MA stock chart with technical analysis and price support and resistance levels. Mastercard 50 and 200 day moving averages.
———————————————————
Twitter: @andrewnyquist and @seeitmarket Facebook: See It Market
No position in any of the securities mentioned at the time of publication.
Any opinions expressed herein are solely those of the author, and do not in any way represent the views or opinions of his employer or any other person or entity.


