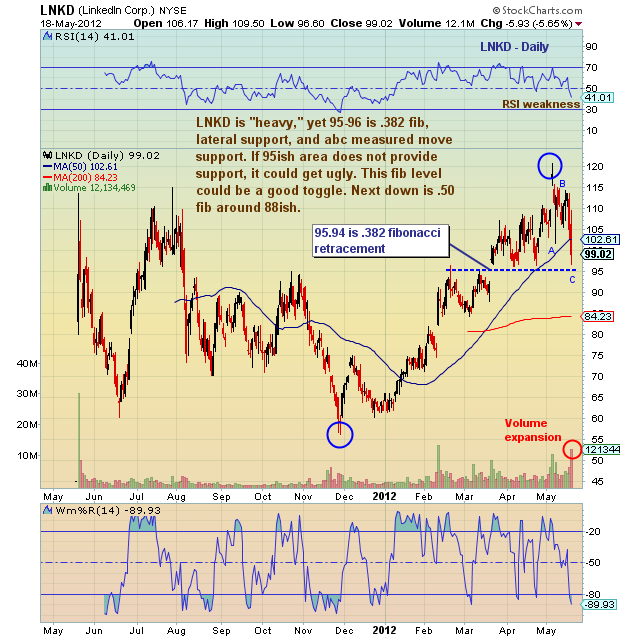
LinkedIn (LNKD) annotated daily stock chart with technical analysis overlay as of May 18, 2012. Price support and resistance Levels. Technical Analysis. Fibonacci Retracement Levels. Measured ABC move. LNKD Stock.
———————————————————
Twitter: @andrewnyquist and @seeitmarket Facebook: See It Market
No position in any of the securities mentioned at the time of publication.
Any opinions expressed herein are solely those of the author, and do not in any way represent the views or opinions of his employer or any other person or entity.


