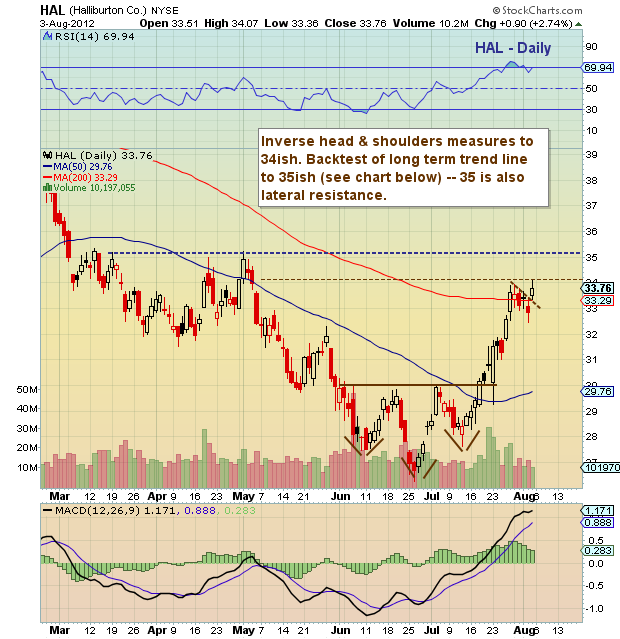
 Halliburton (HAL) spent much of June and early July forming an inverse head and shoulders pattern (bullish). This pattern was triggered in mid-July with a breakout above the neckline around 30 dollars. The measurement of the pattern setup left a target of 34, which was hit today.
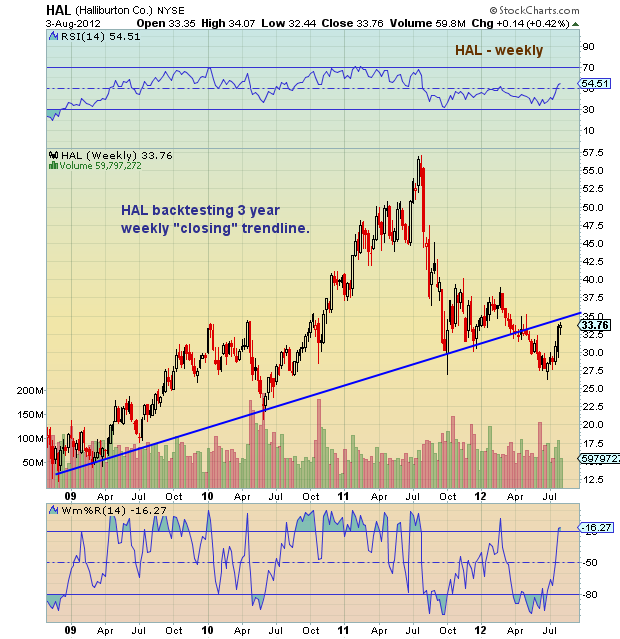
However, many “momentum” technical patterns tend to overshoot their initial short-term targets. That said, 35 is lateral resistance and the backtest level for the 3 year broken weekly “closing” trendline (see weekly chart below).
Halliburton (HAL) stock charts with support and resistance levels and trend lines as of August 3, 2012. HAL technical analysis.
———————————————————
Twitter: @andrewnyquist and @seeitmarket Facebook: See It Market
No position in any of the securities mentioned at the time of publication.
Any opinions expressed herein are solely those of the author, and do not in any way represent the views or opinions of his employer or any other person or entity.


