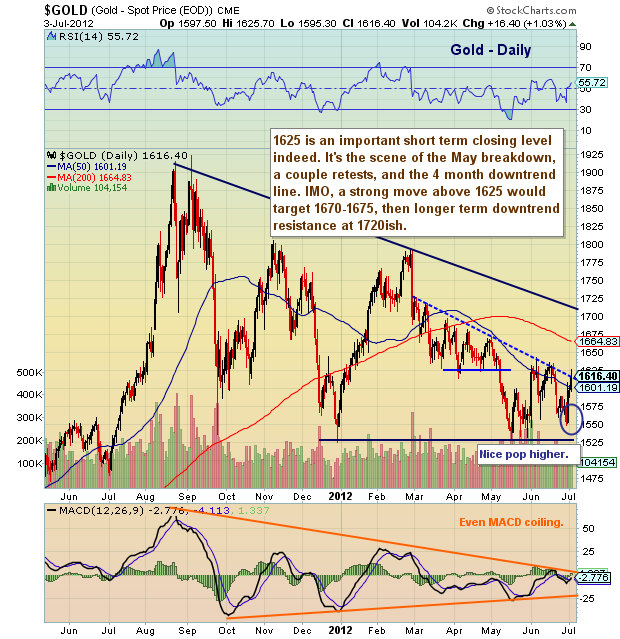
 Gold prices have been giving metal heads heartburn in 2012. But the recent 65 dollar surge near support has many hopeful. First and foremost, Gold must take out 1625, the scene of the May breakdown, lateral resistance, and the 4 month downtrend line. A strong move higher would open the door to the next stair step at 1675.
Gold price chart with support and resistance, trend lines, and price analysis as of July 3, 2012. Precious metals. Gold stock etf is GLD.
———————————————————
Twitter: @andrewnyquist and @seeitmarket Facebook: See It Market
No position in any of the securities mentioned at the time of publication.
Any opinions expressed herein are solely those of the author, and do not in any way represent the views or opinions of his employer or any other person or entity.


