 By Andrew Nyquist
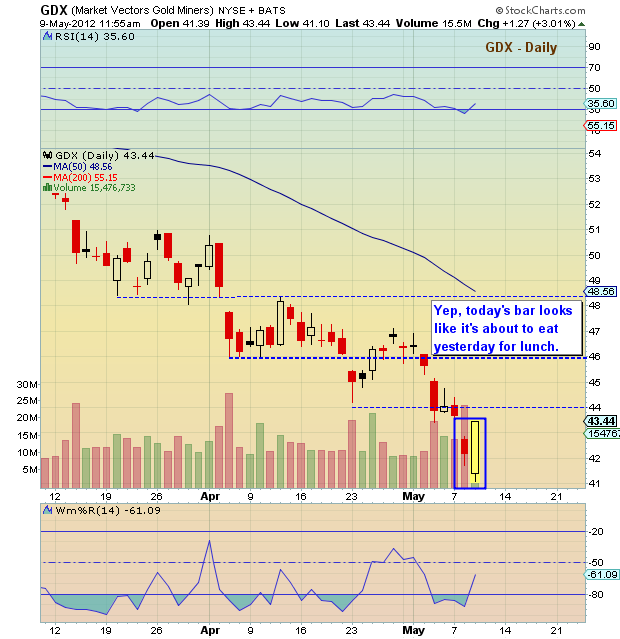
As a follow up to yesterday’s technical post about the Gold Miner’s (GDX) capitulating, take a look at the intraday chart from today (see below). Today’s price bar looks like it’s about to eat yesterday for lunch… and the move comes on high volume. If GDX can close near these levels, that would be near term bullish. Note as well that the 50% fib retracement of the ’08 to ’11 up move (mentioned yesterday) was tagged this morning. With overhead resistance at 44, 46, and 48.50, this is still just a trade. Proper risk management advised.
Gold Miners Index (GDX) annotated daily chart with technical analysis overlay as of May 9, 2012. Price Support and Resistance Levels. DeMark Weekly Buy Setup. Related: Gold
———————————————————
Twitter: @andrewnyquist and @seeitmarket Facebook: See It Market
Author has a position in GDX.
Any opinions expressed herein are solely those of the author, and do not in any way represent the views or opinions of his employer or any other person or entity.


