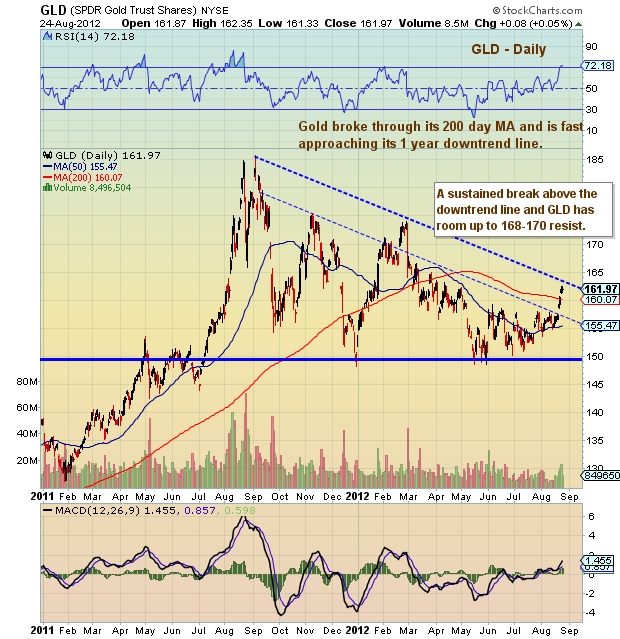
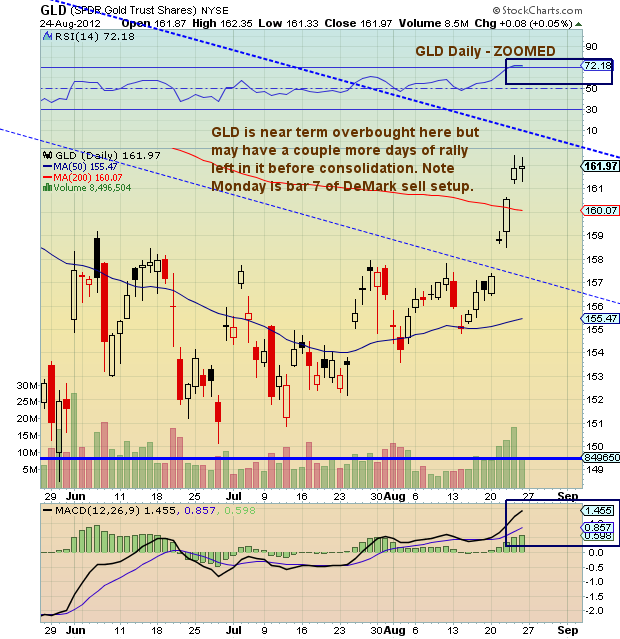
 After flirting with a breakdown in late May, Gold Trust (GLD) consolidated above lower support before breaking to new short term highs. GLD recently broke through its 200 day MA and is approaching its ever important technical downtrend line.
Remember, precious metals tend to be a bit more volatile so waiting an extra day for technical confirmations may be a good idea.
More charts found here.
Gold (GLD) chart with technical analysis overlay as of August 24, 2012. GLD Price support and resistance levels with DeMark analysis. GLD chart with trend lines and technical support levels. GLD technical analysis. Gold – precious metals.
Twitter: @andrewnyquist and @seeitmarket Facebook: See It Market
No position in any of the securities mentioned at the time of publication.
Any opinions expressed herein are solely those of the author, and do not in any way represent the views or opinions of his employer or any other person or entity.


