 By Andrew Nyquist
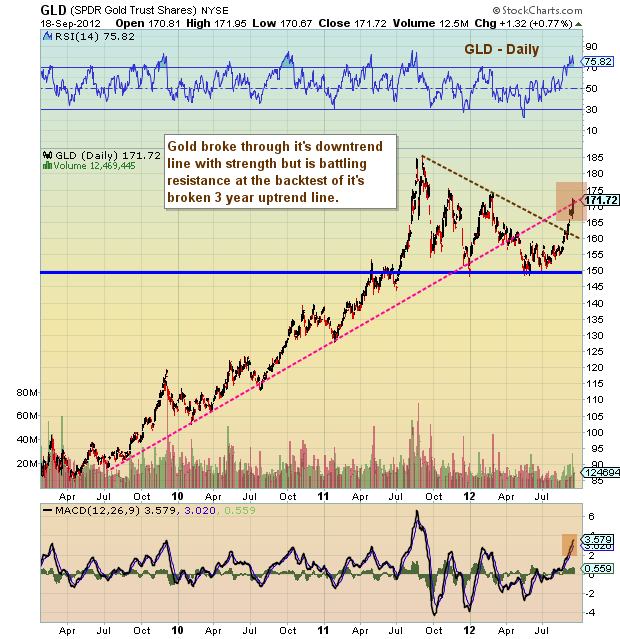
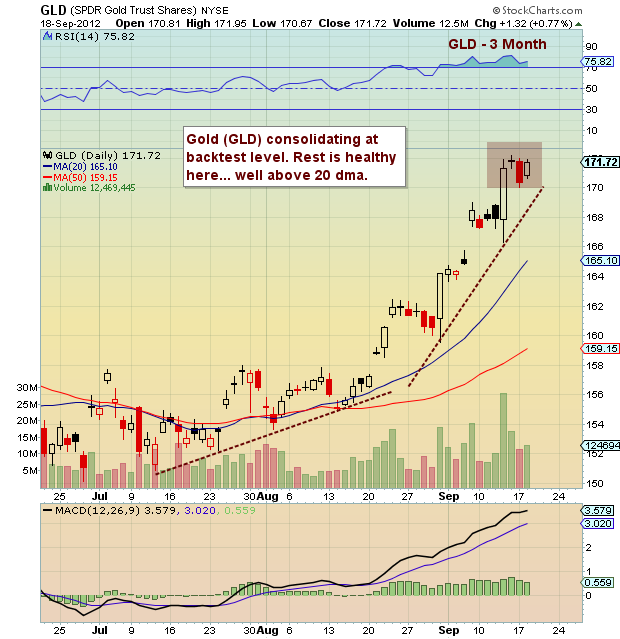
After basing for 3 to 4 months, Gold prices rocketed higher. The recent run began well before the Fed announced its new bond buying program (a possible tip off that QE3 was coming) and continued on after. But the past four sessions have brought consolidation… and more importantly, at a magnetic target: the backtest of the broken 3 year bull trend line.
Broken trend lines often serve as excellent live angles for support and resistance down the road. And this one is a big one, especially upon initial approach. Price action in and around 170-174 will be important to watch in the coming days. Note as well that Gold is well above its 20 day moving average.
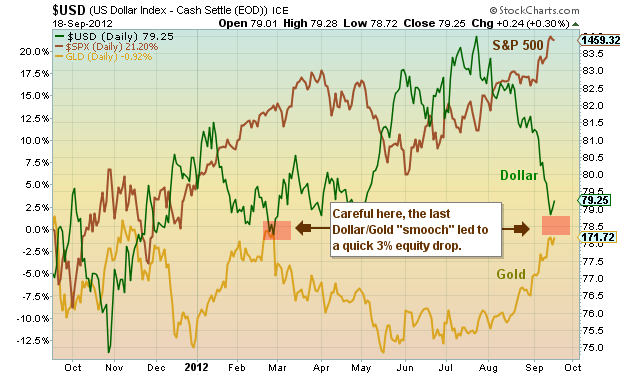
Note that Gold is represented as SPDR Gold Trust (GLD) in the charts below. See also the bonus chart: Gold and Equities versus the Dollar.
More charts found here.
Lastly here’s an add on chart, updated from my “Market Update” this past weekend.
Gold (GLD) charts with technical analysis as of September 18, 2012. GLD Price support and resistance levels with trend lines. GLD technical analysis post QE3. Gold – precious metals.
———————————————————
Twitter: @andrewnyquist and @seeitmarket Facebook: See It Market
No position in any of the securities mentioned at the time of publication.
Any opinions expressed herein are solely those of the author, and do not in any way represent the views or opinions of his employer or any other person or entity.


