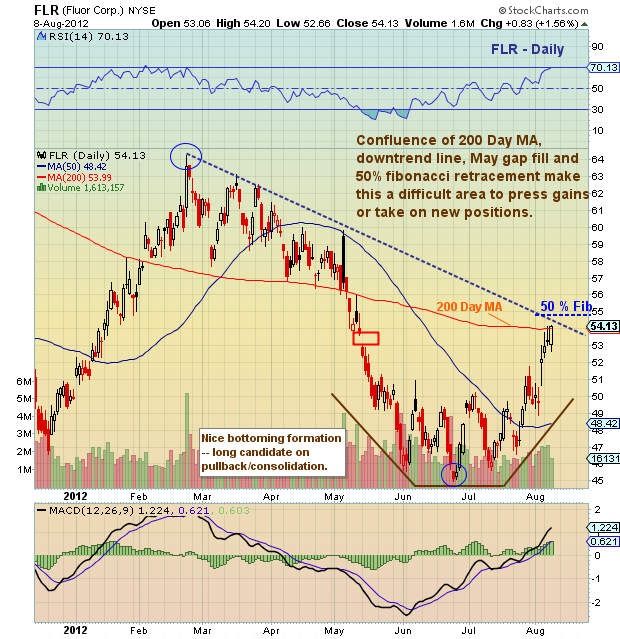
 Fluor (FLR) formed a nice rounded bottom during a two month basing process in June and July. The stock then rocketed higher, and is closing in on a confluence of resistance: 200 day MA, May gap fill, 50% retracement, and descending downtrend line. How the stock reacts to this area will be telling.
Fluor (FLR) stock chart with technical analysis overlay as of August 8, 2012. FLR stock chart with technical analysis and price support and resistance levels. FLR 50 percent fibonacci support level.
———————————————————
Twitter: @andrewnyquist and @seeitmarket Facebook: See It Market
No position in any of the securities mentioned at the time of publication.
Any opinions expressed herein are solely those of the author, and do not in any way represent the views or opinions of his employer or any other person or entity.


