 By Andrew Nyquist
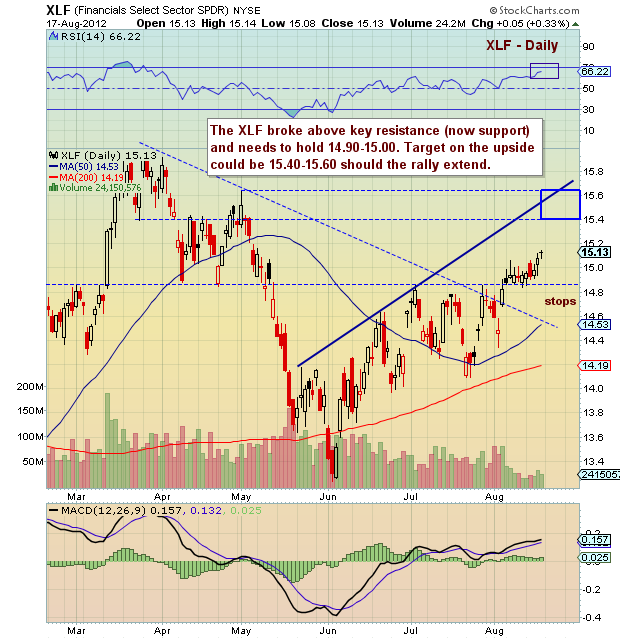
Although the Financial Select Sector (XLF) has not been overly flashy, it has played a key role in the recent stock market rally. Most importantly, the XLF has shown resilience, breaking above key resistance… but now the index must hold on to it!
This is where things get tricky. Volume on the Financials breakout has been paltry and the XLF is still well off its April highs. As well, many other financials are sharing in on the low volume fun and still have overhead resistance to deal with. For instance, Bank of America (BAC) has been a solid performer, but a resistance band up to 8.30 should be formidable. As well, JPMorgan (JPM) has an over head gap from 38-40 to contest. On the flip side, Goldman Sachs (GS) is trying to make a comeback with a nice rounded bottom, but again on low volume.

Light volume means any negative financial news event could hit the sector… but that said, should the rally continue, 15.40-15.60 looks like a logical target on the upside (and one within the confines of resistance on the underlying stocks. Bulls would like to see some follow through on increased volume to send a message to the bears that they mean business.
More charts found here.
Financials Select Sector (XLF) chart as of August 17, 2012. XLF price support and resistance levels with technical analysis. XLF stock chart with trend lines and technical support levels. XLF technical analysis. Financial sector and stocks.
———————————————————
Twitter: @andrewnyquist and @seeitmarket Facebook: See It Market
No position in any of the securities mentioned at the time of publication.
Any opinions expressed herein are solely those of the author, and do not in any way represent the views or opinions of his employer or any other person or entity.


