 By Andrew Nyquist
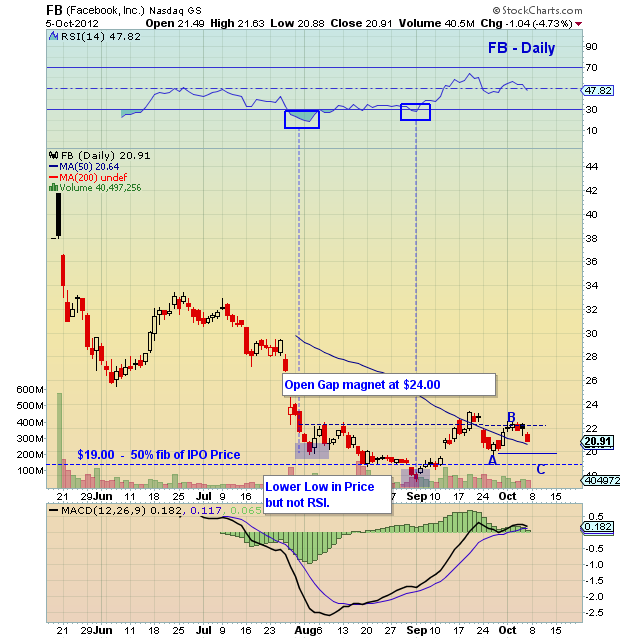
For the past 2 plus months, Facebook (FB) has been range bound between $18 and $23, attempting to carve out and form a rounded bottoming pattern. The pattern has given Facebook stock holders tenuous hopes that higher prices may be in future over the intermediate term.
But everywhere investors turn, they are told about Facebook’s dramatic downside, it’s inability to monetize mobile ads, and the additional stock soon to be dumped on the market. And to make matters worse, there’s a little thing called valuation that analysts and investors are hung up on, and concerned about. But at some point, what we know and expect starts to get priced into a stock, allowing “new” revelations or dramatically worse or better than expected news to lead the way.
Now that may sound fine and dandy, and even a bit bullish, but as of right now I do not have a position in the stock. And more precisely, if and only if, the stock follows the bottom patterning outlined below, will I entertain going long for a swing trade. It’s gotten pretty negative out there and the stock has some clear levels to buy into (and set stops against).
So where are these levels? Well, the stock has symmetrical and lateral support around $20 and stronger Fibonacci support at $19. Both of these levels offer pretty good risk-reward for an “average-in” position on a swing trade (with a stop below $19 depending upon personal risk profile). An initial intermediate term target would be the open gap between $24-$26.
All of this is just speculation as of right now, so stay tuned to the price action. And remember to always trade safe and stay disciplined.
Previous Facebook (FB) analysis here.
More Charts here.
Facebook (FB) stock chart as of October 5, 2012. FB technical support and resistance levels with fibonacci retracements. FB technical analysis. Facebook price performance post IPO.
———————————————————
Twitter: @andrewnyquist and @seeitmarket Facebook: See It Market
No position in any of the securities mentioned at the time of publication.
Any opinions expressed herein are solely those of the author, and do not in any way represent the views or opinions of his employer or any other person or entity.


