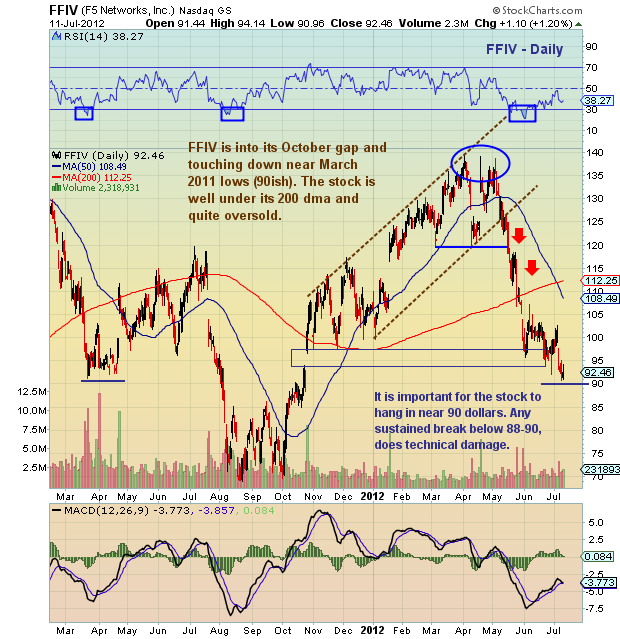
 After forming a bearish double top earlier this spring, F5 Networks (FFIV) stock fell hard. The drop was steep and many investors ran for cover. And while the past 5 weeks hasn’t come up roses by any means, the stock has slowed its drop and ground lower alongside the market.
From a purely technical vantage point, it is important to note that the stock is close to filling its October 2011 gap (88.76). Note also that the 88-92 level is the last band of support and may help the stock find some traction.
F5 Networks (FFIV) stock chart with price support and resistance levels and technical analysis as of July 11, 2012. FFIV stock oversold and filling October 2011 gap. F5 Networks stock ticker is FFIV.
———————————————————
Twitter: @andrewnyquist and @seeitmarket Facebook: See It Market
No position in any of the securities mentioned at the time of publication.
Any opinions expressed herein are solely those of the author, and do not in any way represent the views or opinions of his employer or any other person or entity.


