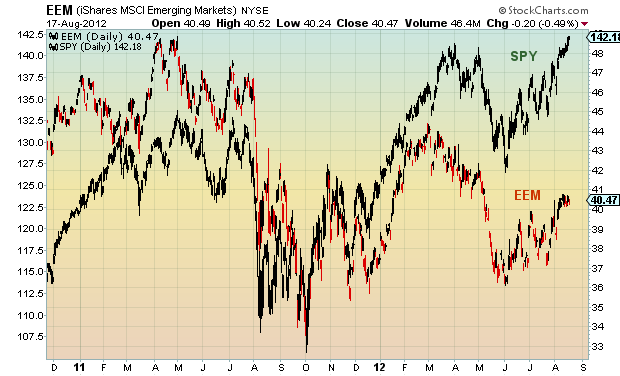
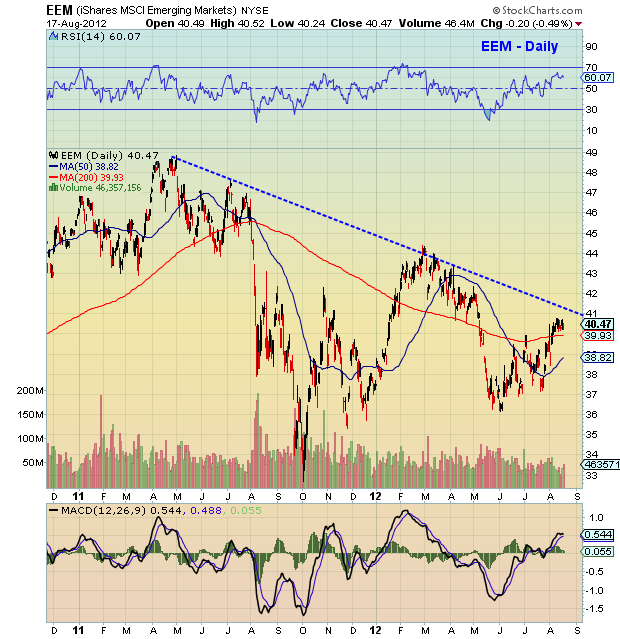
 Since early February, the Emerging Markets (EEM) have really lagged the major U.S. indices (here shown against the S&P 500 index fund – SPY). This can mean one of two things: either the emerging markets are going to play catch up, or the S&P 500 is going to slow or pull in. Either one of these scenarios raises a yellow caution flag for the macro picture.
A healthy market would see the S&P 500 consolidate gains while the Emerging markets play catch up, but this seems unlikely as any news rallying Emerging Markets would likely be positive news here as well.
More charts found here.
iShares Emerging Markets (EEM) chart as of August 17, 2012. EEM price support and resistance levels with technical analysis. EEM stock chart with trend lines and technical support levels. EEM technical analysis. Emerging Markets global analysis.
———————————————————
Twitter: @andrewnyquist and @seeitmarket Facebook: See It Market
No position in any of the securities mentioned at the time of publication.
Any opinions expressed herein are solely those of the author, and do not in any way represent the views or opinions of his employer or any other person or entity.


