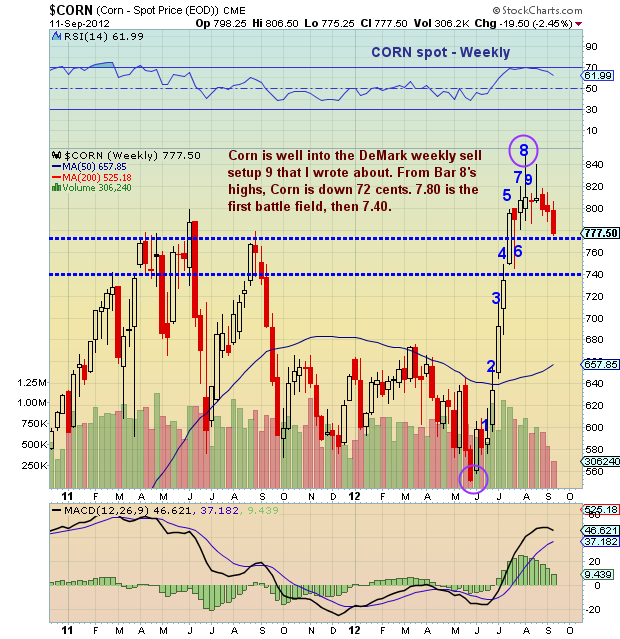
 Weeks ago, as Corn prices were racing higher, I started to look at the daily and weekly charts to see if Corn prices may be nearing a short or intermediate term top. Lo and behold, Corn topped out during weekly bar 8 of a perfected DeMark sell setup (see previous Corn Chartology).
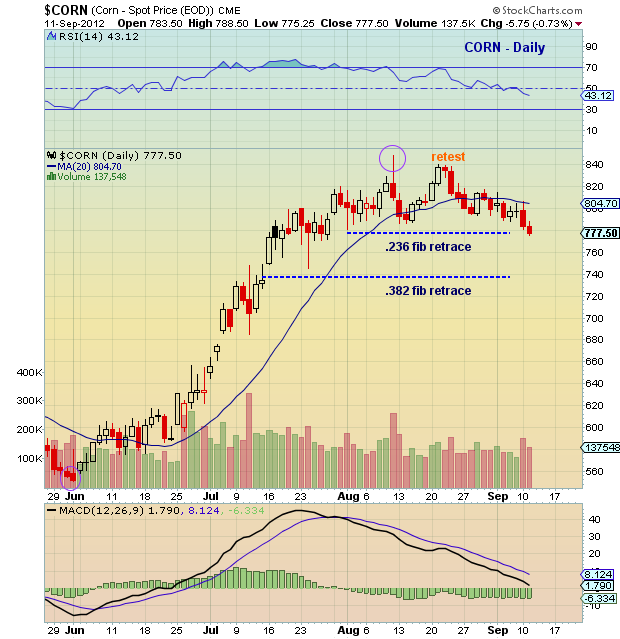
Since recording a weekly sell setup, Corn prices have remained weak, following through lower to the .236 fibonacci retracement around 7.80. Although a recovery cannot be ruled out here and now, Corn prices look like they are targeting the .382 Fibonacci retracement level around 7.40. My thought here is due in part to the rounded topping pattern on the daily chart, but also because the .382 fibonacci Priclevel tends to be a strong magnet. Yes, a bounce here would not be a surprise, but only a move that takes out 8.20 would change my mind about the likelihood of touching down near 7.40 first.
More charts found here.
Corn price charts as of September 11, 2012. Corn technical charts with Fibonacci retracements and technical support levels. Demark analysis.
———————————————————
Twitter: @andrewnyquist and @seeitmarket Facebook: See It Market
No position in any of the securities mentioned at the time of publication.
Any opinions expressed herein are solely those of the author, and do not in any way represent the views or opinions of his employer or any other person or entity.


