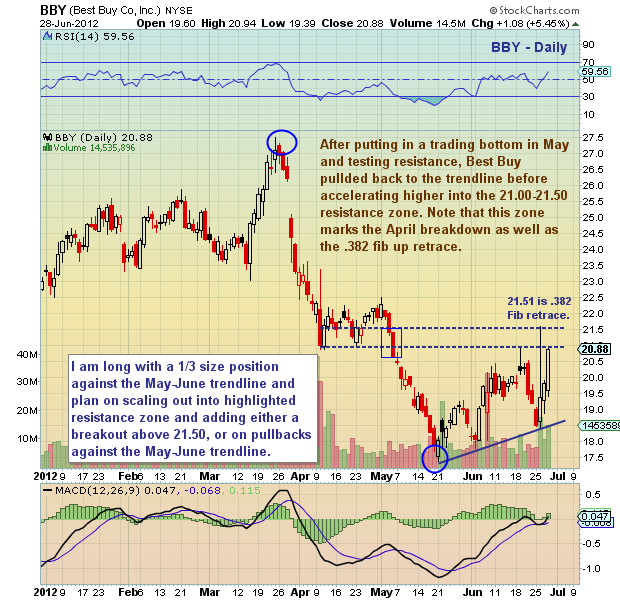
 After putting in a tradable bottom in May, Best Buy (BBY) slowly crept higher, creating a nice “base.” This paid off as the stock has since raced higher. Note, though, that it is now nearing important resistance. I will be selling into resistance, and buying back on a breakout over resistance, or on pullbacks against the current uptrend line.
Best Buy (BBY) annotated stock chart with technical analysis overlay as of June 28, 2012. Price support and resistance levels with trend lines and Fibonacci retrace levels. Retail Sector. Best Buy stock ticker is BBY.
———————————————————
Twitter: @andrewnyquist and @seeitmarket Facebook: See It Market
Position in Best Buy (BBY) at time of publication.
Any opinions expressed herein are solely those of the author, and do not in any way represent the views or opinions of his employer or any other person or entity.


