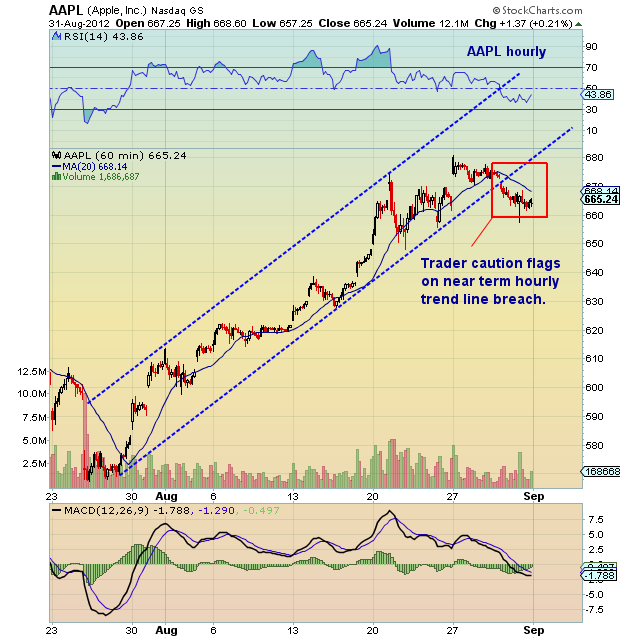
 Apple (AAPL) was faded for much of last week raising short term concerns about the number of “new” longs that may have been trapped on the Samsung patent news excitement. Note that although Apple is the king of stock snap back rallies, this type of action tends to add to overhead supply and may push some backing and filling.
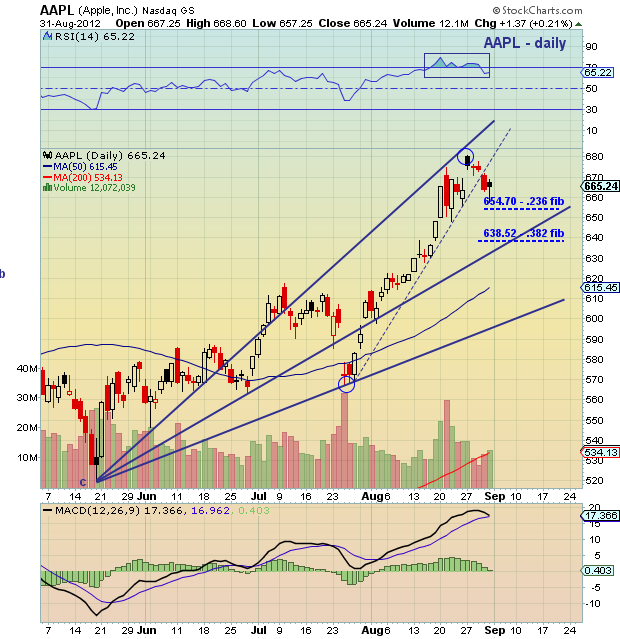
On the daily chart, you’ll notice fibonacci support around 654 (almost hit) and 638 respectively. MACD is starting to turn lower on the daily bar chart – keep an eye on this.
Note as well that volume should return next week as the big boys return from summer and holiday vacation. Trade safe, trade disciplined. Good luck!
More charts found here – previous Apple Chartology here.
Apple, Inc. (AAPL) stock charts as of August 31, 2012. AAPL technical support and resistance levels with fibonacci retracement levels. AAPL technical analysis with channel trend lines. AAPL stock Monday gap higher on Samsung patent news.
———————————————————
Twitter: @andrewnyquist and @seeitmarket Facebook: See It Market
No position in any of the securities mentioned at the time of publication.
Any opinions expressed herein are solely those of the author, and do not in any way represent the views or opinions of his employer or any other person or entity.


