 By Andrew Nyquist
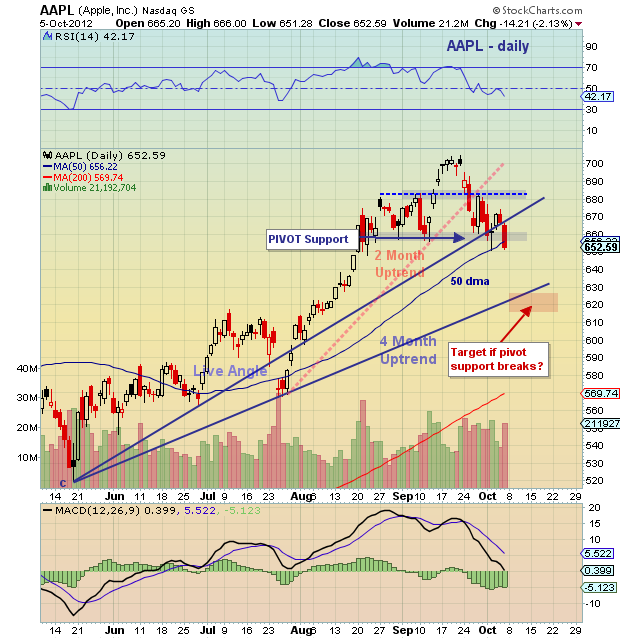
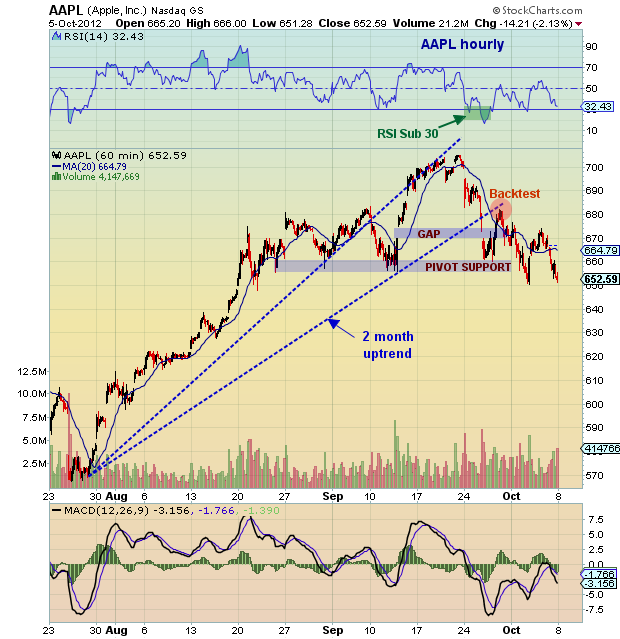
On Tuesday, Apple (AAPL) traded through pivot support around 660. As mentioned in my last update, the 50 day moving average was first support, albeit a weaker one than the pivot itself. Apple found it’s way down to 650 and the 50 day ma before putting on a 2 day rally. Problem is, that rally formed a bit of a right shoulder and likely weakened the stock.
And depending upon how it trades early next week, the initial move through pivot support may have been a warning for AAPL traders to tighten up risk. If the stock pushes lower, a likely target zone will be 615-625 (previous break out area). AAPL isn’t out, but definitely on the ropes.
Trade safe, trade disciplined.
Previous AAPL Chartology’s and Commentary here.
More Charts here.
Apple (AAPL) stock charts as of October 5, 2012. AAPL technical support and resistance levels with trend lines. Apple (AAPL) technical analysis. Head and shoulders pattern.
———————————————————
Twitter: @andrewnyquist and @seeitmarket Facebook: See It Market
No position in any of the securities mentioned at the time of publication.
Any opinions expressed herein are solely those of the author, and do not in any way represent the views or opinions of his employer or any other person or entity.


