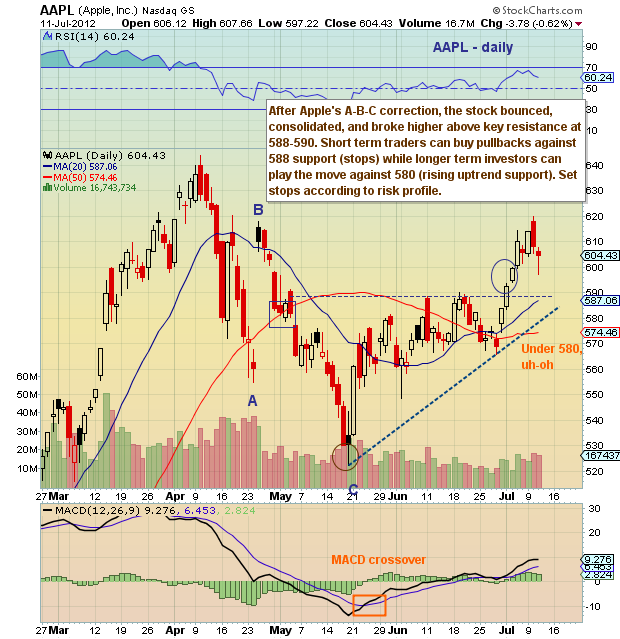
 Last week, Apple (AAPL) surged through resistance around 590 like a hot knife through butter. At the time, I posted a daily chart (calling it the “chart of the week“), adding that a retest of the 590 level would offer a good risk-reward entry point for traders. Well, today came close… maybe close enough for some.
Note that additional technical support can be found the old fashioned way; using a crayola and ruler and creating a rising uptrend line. Now at 580, this layer of support is arguably more important than the lateral support found at 590. Either way, Apple trading longs should keep a watchful eye on both support levels, with laser focus on the uptrend support — using that as line in the sand for stops. Discipline over conviction.
Apple (AAPL) stock chart with price support and resistance levels and technical analysis as of July 6, 2012. Measured ABC move. AAPL stock breakout.
———————————————————
Twitter: @andrewnyquist and @seeitmarket Facebook: See It Market
No position in any of the securities mentioned at the time of publication.
Any opinions expressed herein are solely those of the author, and do not in any way represent the views or opinions of his employer or any other person or entity.


