 By Andrew Nyquist
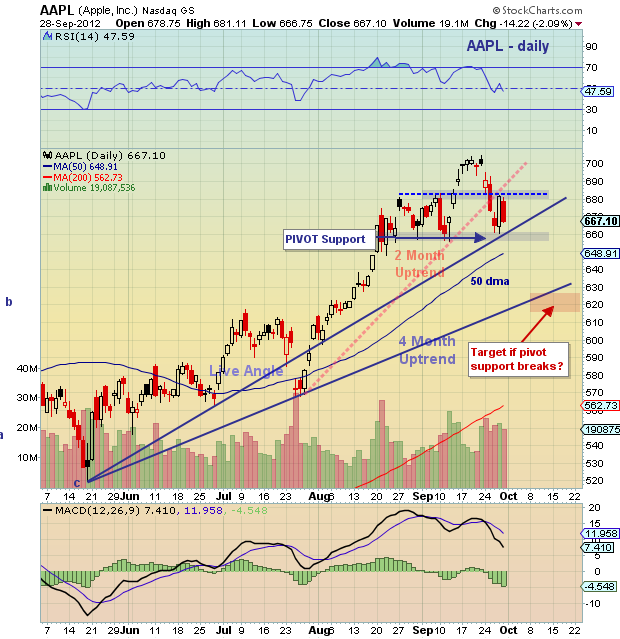
After trading lower on Friday, Apple’s (AAPL) stock price looks a bit heavy. Pivot support resides in the 660 area (we’ll give it to 655), and since this area has been tested recently, it would be wise for traders (and investors) to create a risk management plan (as well as a trading plan, identifying lower support levels should this pivot support give way).
In short, AAPL could stumble as low as 615-625; this area marks the prior breakout area and 4 month uptrend line. One hope, though, is that the 50 day moving average around 650 will hold. But holding that level would be a tall order if pivot support doesn’t hold. No doubt, October will be an interesting month for Apple’s stock price, as well as the stock market.
Note that Alex Salomon (SIM contributor) will be providing a piece on Apple that offers up similar near term concerns for the stock, as well as the overall market. Be sure to tune into his coming blog!
And as always, trade safe, trade disciplined.
Previous AAPL Chartology here.
More Charts here.
Apple (AAPL) daily stock chart as of September 25, 2012. AAPL technical support and resistance levels with trend lines and open gaps. Apple (AAPL) technical analysis.
———————————————————
Twitter: @andrewnyquist and @seeitmarket Facebook: See It Market
No position in any of the securities mentioned at the time of publication.
Any opinions expressed herein are solely those of the author, and do not in any way represent the views or opinions of his employer or any other person or entity.


