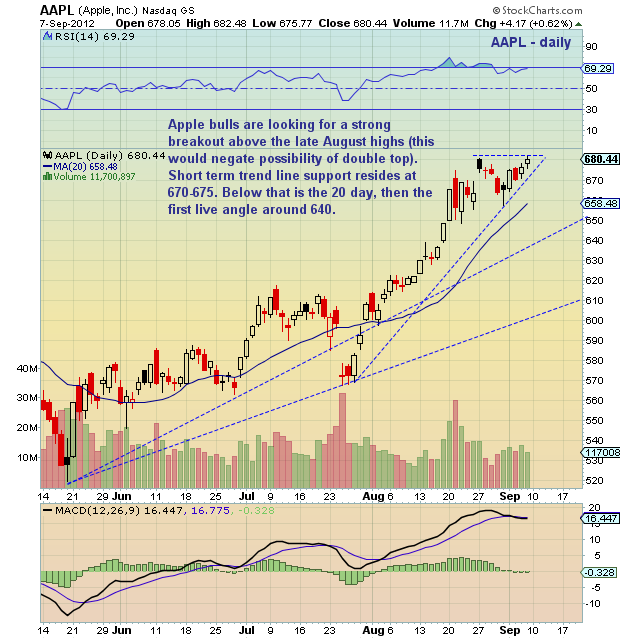
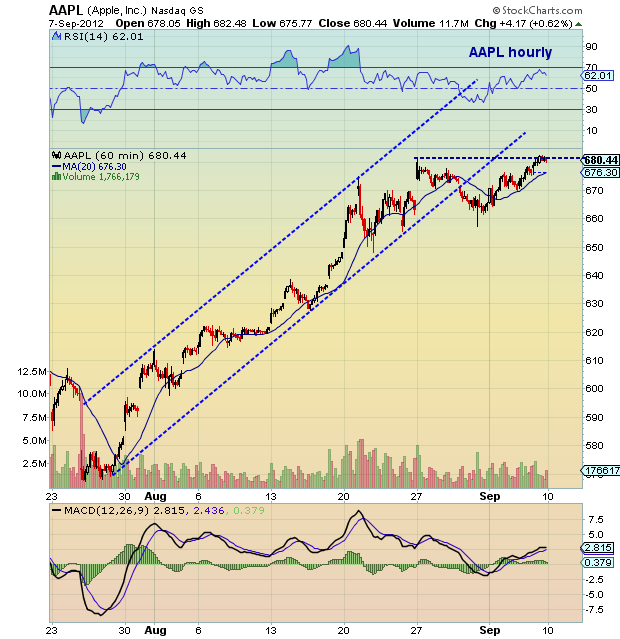
 After bursting higher last Monday and reversing lower for the next several days, Apple (AAPL) nearly touched its .382 fib before reversing back higher (see previous chartology here). Now Apple stock finds itself back at the old highs; or rather, the scene of the crime.
Apple 680 bears importance because this is the level from which the stock reversed lower following the Samsung patent news. A sustained break higher could lead to 700, while a failure could set up a short term double top. Support resides below at the near term trend line around 670-675, followed by the 20 day MA. Lower yet is the live angle around 640. Trade safe.
More Charts here.
Apple, Inc. (AAPL) stock charts as of September 7, 2012. AAPL technical support and resistance levels with channel trend lines. AAPL technical analysis. AAPL 680.
———————————————————
Twitter: @andrewnyquist and @seeitmarket Facebook: See It Market
No position in any of the securities mentioned at the time of publication.
Any opinions expressed herein are solely those of the author, and do not in any way represent the views or opinions of his employer or any other person or entity.


