 By Andrew Nyquist
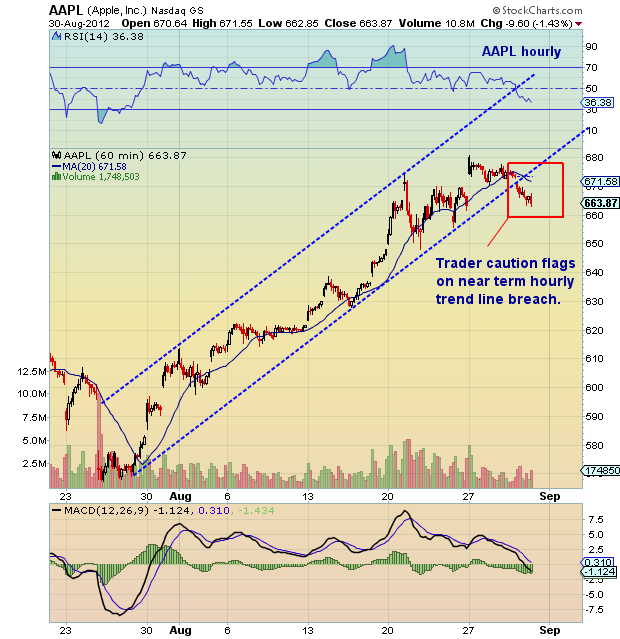
After surging Monday on weekend news that Apple (AAPL) was taking it to Samsung in the courtroom, the stock has slowly pulled in all week; this could set up as a bearish trend week. As well, the stock has breached the hourly trend line from the recent 570 lows, so caution is warranted for short term traders.
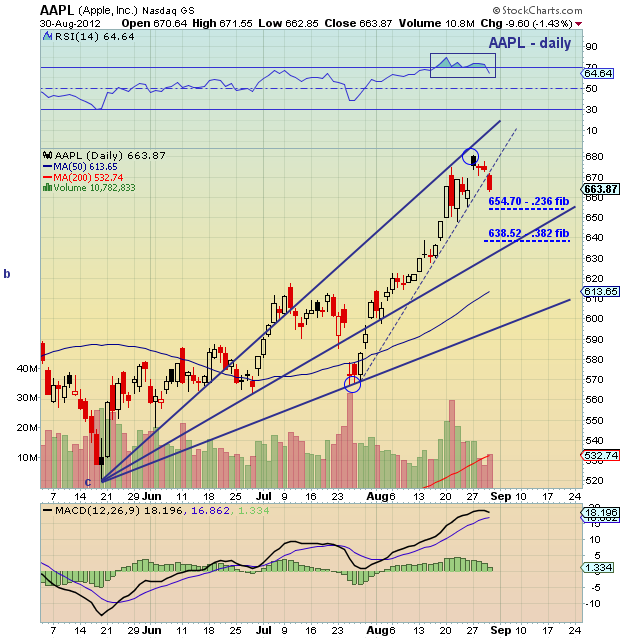
On the daily chart, you’ll notice fibonacci support around 654 and 638 respectively. MACD is starting to turn down on the daily bar chart – good to keep an eye on this. Trade safe, trade disciplined. Good luck!
More charts found here – previous Apple Chartology update here.
Apple, Inc. (AAPL) charts as of August 30, 2012. AAPL technical support and resistance levels with fibonacci retracement levels. AAPL stock chart technical analysis with channel trend lines. AAPL stock Monday gap higher on Samsung patent news.
———————————————————
Twitter: @andrewnyquist and @seeitmarket Facebook: See It Market
No position in any of the securities mentioned at the time of publication.
Any opinions expressed herein are solely those of the author, and do not in any way represent the views or opinions of his employer or any other person or entity.


