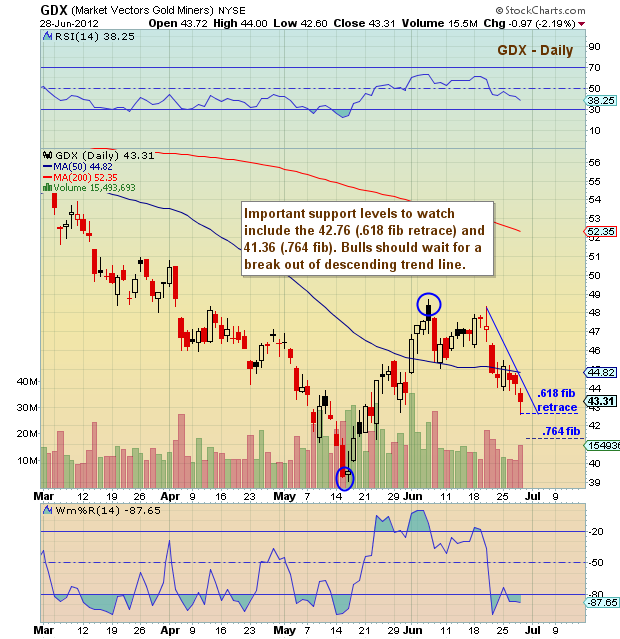
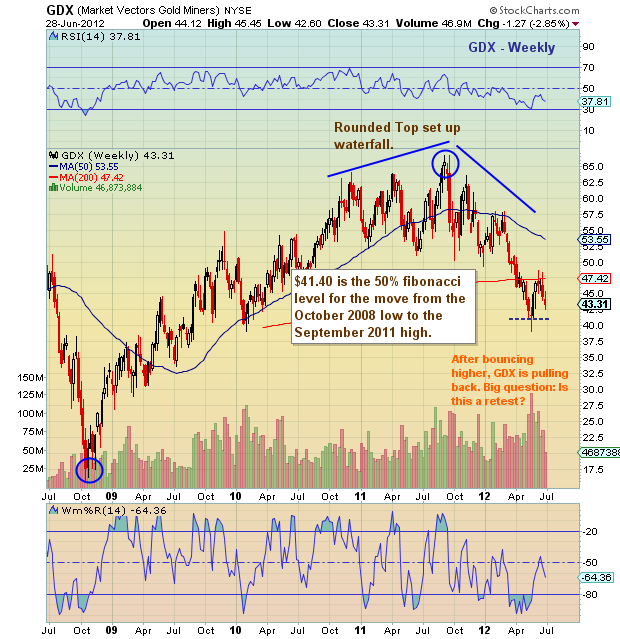
 The Gold Miners index (GDX) may be retesting recent lows with a stealth, low volume retest. Important support levels to watch are the .618 fibonacci retrace level at 42.76 (most important), and the .764 fibonacci retrace level at 41.36 (which is also the 50% retrace mark of the 2008-2011 run — see weekly chart below.

Gold Miners (GDX) stock charts with support and resistance levels as of June 28, 2012. Important Fibonacci retrace levels. Gold miners index stock ticker GDX.
———————————————————
Twitter: @andrewnyquist and @seeitmarket Facebook: See It Market
No position in any of the securities mentioned at the time of publication.
Any opinions expressed herein are solely those of the author, and do not in any way represent the views or opinions of his employer or any other person or entity.


