The U.S. equity market saw a wide swathe of indices break out this week.
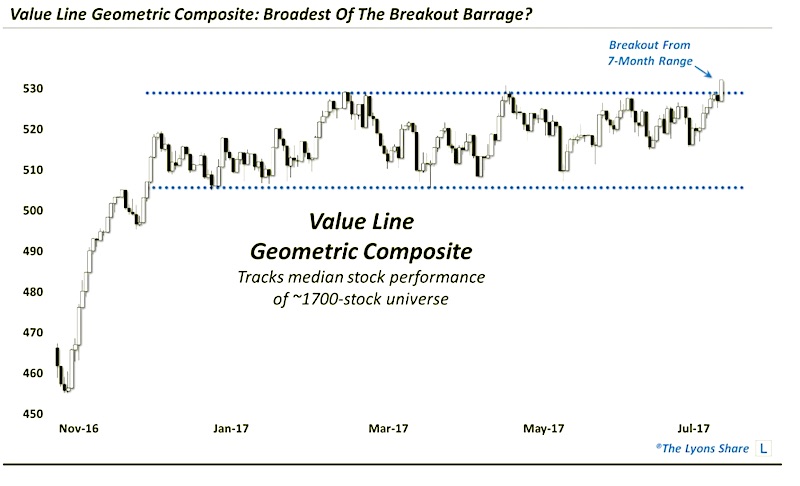
Perhaps the broadest and most important breakout was the Value Line Geometric Index (INDEXNYSEGIS:VALUG).
Wednesday’s rally on Wall Street led not only to new highs again among the popular large cap indices, but also to breakouts from extended ranges among numerous small-cap, mid-cap and broad market indices. Of the myriad of new highs, perhaps the most important, in our eyes, was that of the Value Line Geometric Index (VLG).
As a refresher, the VLG tracks the performance of the median stock within a universe of approximately 1700 stocks. Thus, it is an extensive measure of the broad equity market and, in fact, is our favorite barometer of the health of the overall U.S. market.
Following the presidential election last fall, the Value Line Geometric Index surged to new highs, like many indices. And like many non-large cap indices, it has been in a trading range over the 7 months since. In fact, the Value Line Geometric Index hasn’t even scored a new marginal high since February. That is, until yesterday.
Given our view, again, of the VLG and its status as an accurate barometer of the health of the broad equity market, this breakout to new highs is a very healthy development. It doesn’t mean the market can’t become sick rather quickly. However, for now, this breakout in the Value Line Geometric Composite is probably the best medicine of all the breakouts occurring yesterday.
In our next post, we’ll discuss just how many popular stock averages managed to hit new highs yesterday – and what the message behind that may be. You can catch more of my in-depth work over on The Lyons Share. Thanks for reading.
Twitter: @JLyonsFundMgmt
The author may have a position in mentioned securities at the time of publication. Any opinions expressed herein are solely those of the author, and do not in any way represent the views or opinions of any other person or entity.


