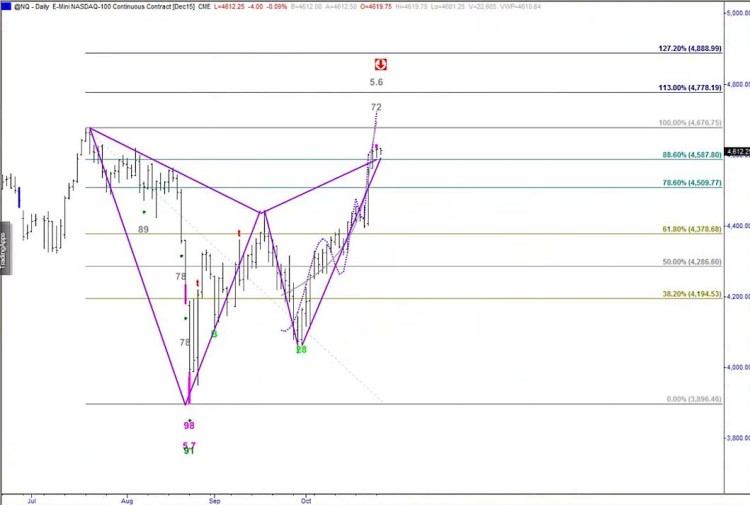
It’s not every day that I get a really interesting pattern in my scans. But the chart pattern below of the Nasdaq futures was too good not to share.
With most harmonics followers finding the bearish animals in some of the indexes, I thought it was appropriate to share one of the few that has something “extra special” to it.
The Nasdaq Futures not only has produced a strong bearish harmonic pattern, but it has also activated an Extreme Hurst Top extension signal. This suggests that the broader tech market should be flat to down over next 1-2 months.
This is a great example of layering multiple methods. Note that the end Extremehurst(TM) signals are provided by Parallax Financial Research, a partner that I work with.
Nasdaq Futures Chart
Thanks for reading and good luck the rest of the week.
Twitter: @interestratearb
The author is short QQQ call spreads at the time of publication. Any opinions expressed herein are solely those of the author, and do not in any way represent the views or opinions of any other person or entity.


