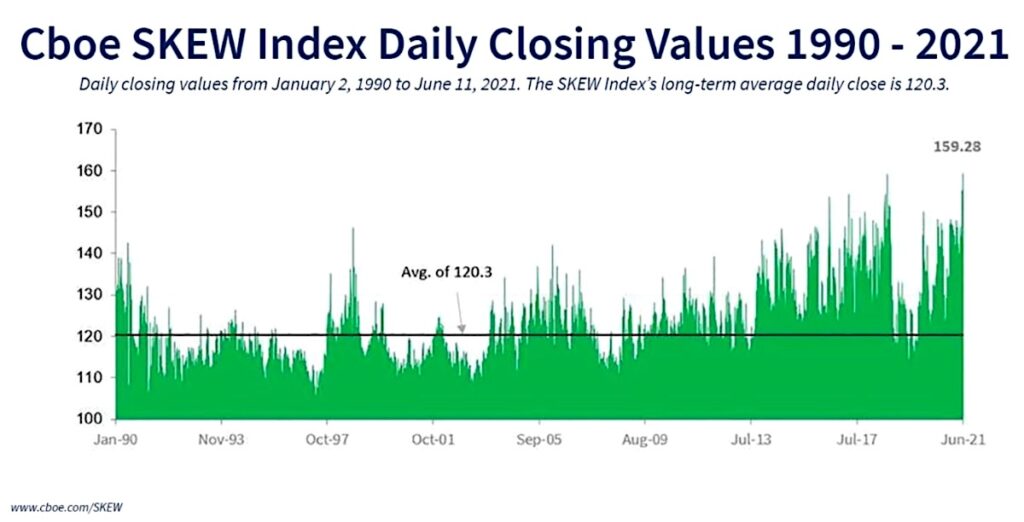
The CBOE SKEW Index is trading at new all-time highs, which I think will prove accurate in suggesting volatility is right around the corner.
Created in 1990, the CBOE SKEW Index measures the difference in price volatility for Calls vs Puts, and when elevated, it shows that investors are hedging for market risk over the next 30-day period.
It doesn’t always signal concern as the 3 month forward return after 2016 and 2017 both were positive. However, it did appear shortly ahead of the Flash Crash in 2010 and at 2011 peaks, not to mention prior to the late 2015 decline into early 2016 and also prior to last year’s stunning 33% decline in 33 calendar days (Hit all-time highs back in December 2019).
Overall, it is not always right to view this hedging (which would drive the cost of puts higher relative to calls) as negative. That said, it is also not always positive either from a contrarian standpoint, as it has had its fair degree of success over the years. It does suggest that we should be very selective in what to buy heading into the back half of June into July at a minimum, and consider keeping stops tight on longs.
If you have an interest in reading more thorough technical research twice a day, please visit NewtonAdvisor.com. Additionally, feel free to send me an email at info@newtonadvisor.com and I’d be happy to send you copies of recent reports or add you to a trial of my work. Individual and Institutional clients are shown pre-market thoughts on several markets and asset classes, mid-day thoughts and long/short ideas at @MLNewtonAdvisors (private Twitter). Email for details.
Twitter: @MarkNewtonCMT
Author has positions in mentioned securities at the time of publication. Any opinions expressed herein are solely those of the author, and do not in any way represent the views or opinions of any other person or entity.


