As inflation concerns remain in the headlines, today we look at the potential of food inflation by looking at cattle futures prices (i.e. beef).
Earlier this week we analyzed hard commodities Copper and Silver, as they are inputs and indicators for industrial inflation.
Cattle futures prices have rallied sharply and have reached an inflection point of great concern for those worried about inflation.
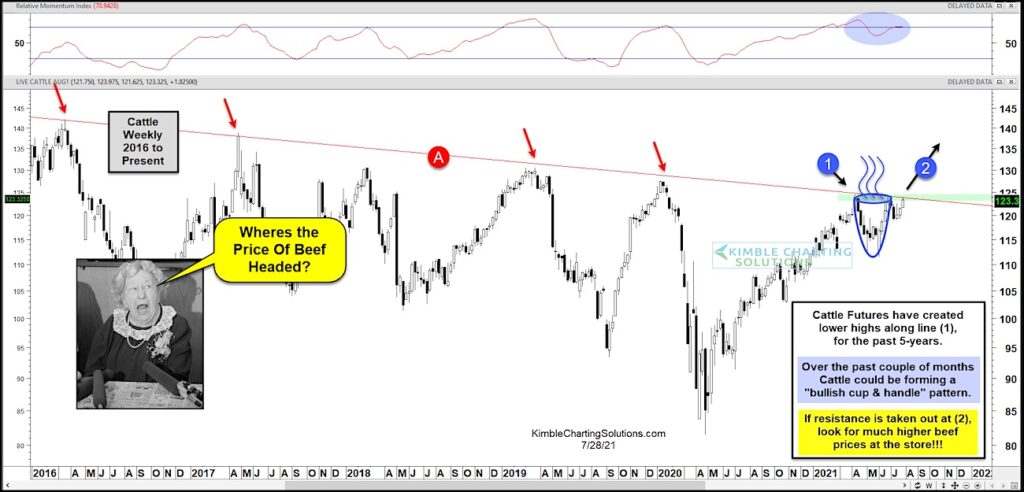
Below is a “weekly” chart of cattle futures that tries to show what to watch when asking “Where’s the price of beef headed?”
Over the past 5 years, cattle futures have created lower highs (red arrows) while remaining in a wide-ranging down-trend, marked by (A). But cattle prices have surged over the last 18 months and more recently formed a bullish cup and handle pattern at (1).
It just so happens that this cup and handle pattern is also testing down-trend resistance (A). A breakout above resistance at (2) could be a signal that food inflation is ready to creep into consumers budgets.
We could pay a ton more for beef at the store if a breakout takes place at (2)! Stay tuned!
Cattle Futures Prices “weekly” Chart

Note that KimbleCharting is offering a 2 week Free trial to See It Market readers. Just send me an email to services@kimblechartingsolutions.com for details to get set up.
Twitter: @KimbleCharting
Any opinions expressed herein are solely those of the author, and do not in any way represent the views or opinions of any other person or entity.


