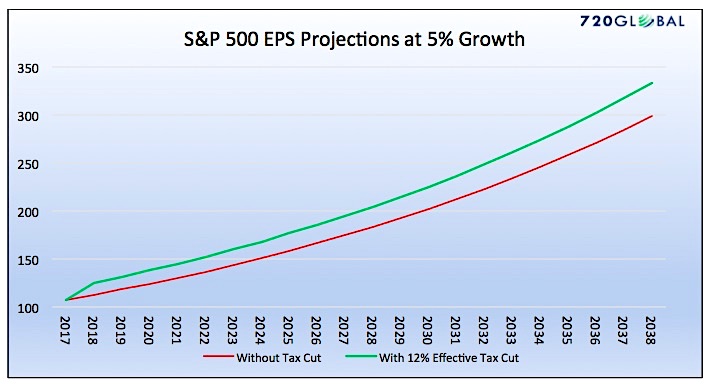
2018 Tax Reform Offers Short-Term Gain, Long-Term Pain
The new tax plan, in my opinion, is not overly significant.
From an economic standpoint, since other nations have lower corporate tax rates, there is...
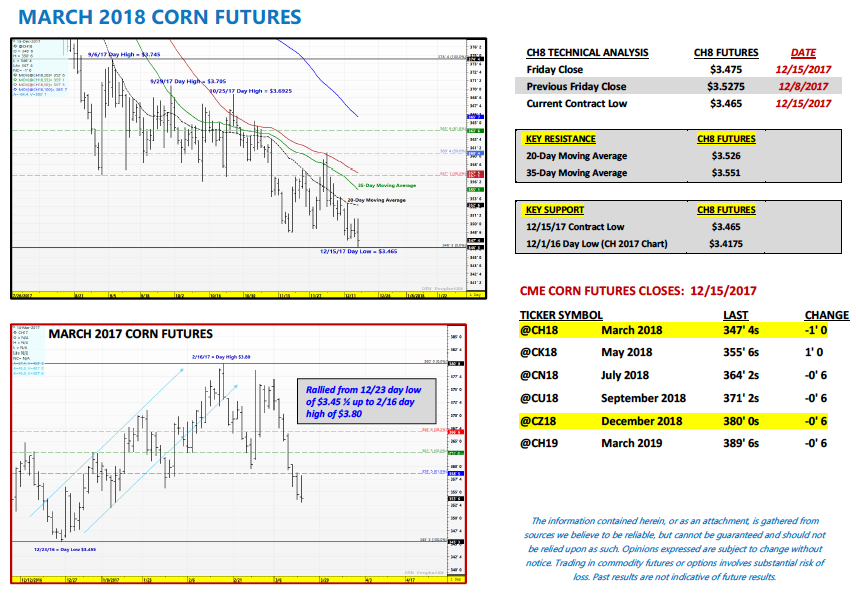
U.S. Corn Market Outlook: How Much Bad News Is Priced In?
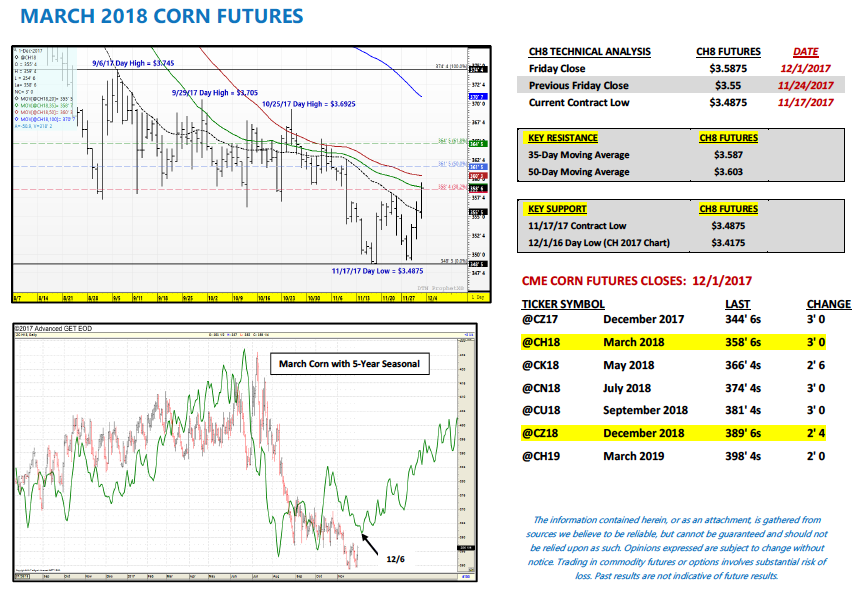
U.S. March corn futures closed down 5 ¼ cents per bushel week on week, finishing at $3.47 ½.
Corn bulls are on the ropes as...
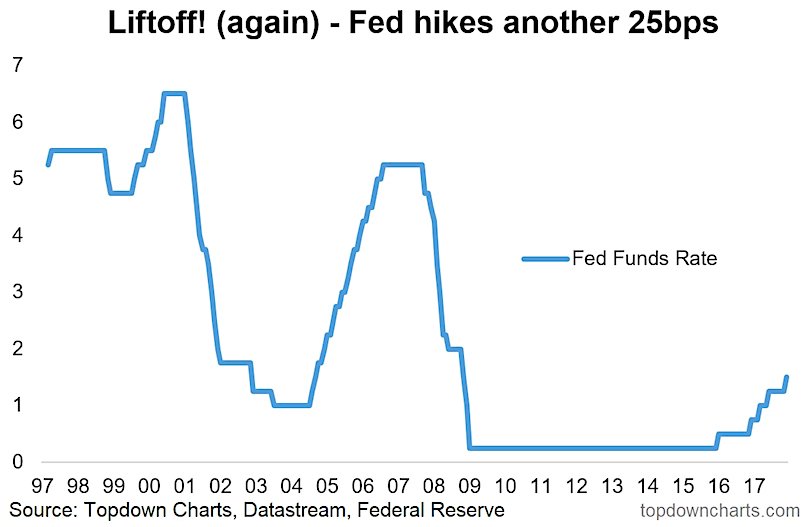
Will The Federal Reserve Raise Interest Rates In 2018?
Much as I expected, the Federal Reserve hiked again in its December meeting. In the background, the Fed continues to wind down its balance sheet by reducing...
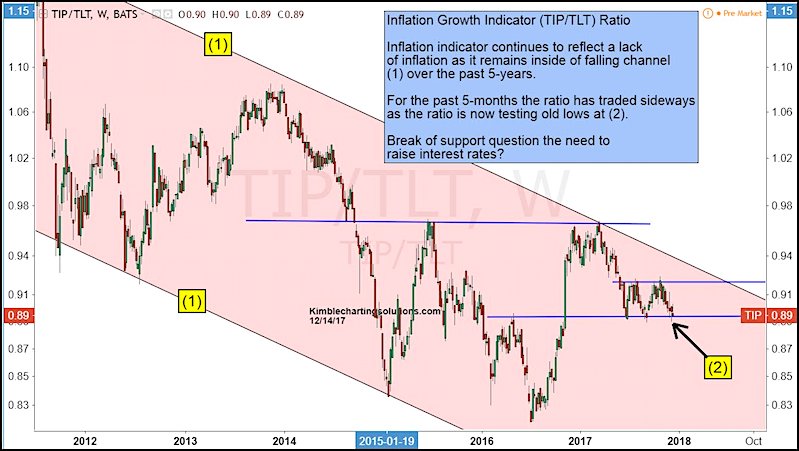
Inflation Indicator Highlights Uncertainty For Bond Traders
Well rounded investors and traders need to understand what's happening across asset classes. If money is coming out of one asset class, it's likely...
Research Update: Stocks Bullish For Now, But 2018 Awaits…
The world does not always come at you the way you expect.
In lieu of a "Market Update" this week, I would like to direct...
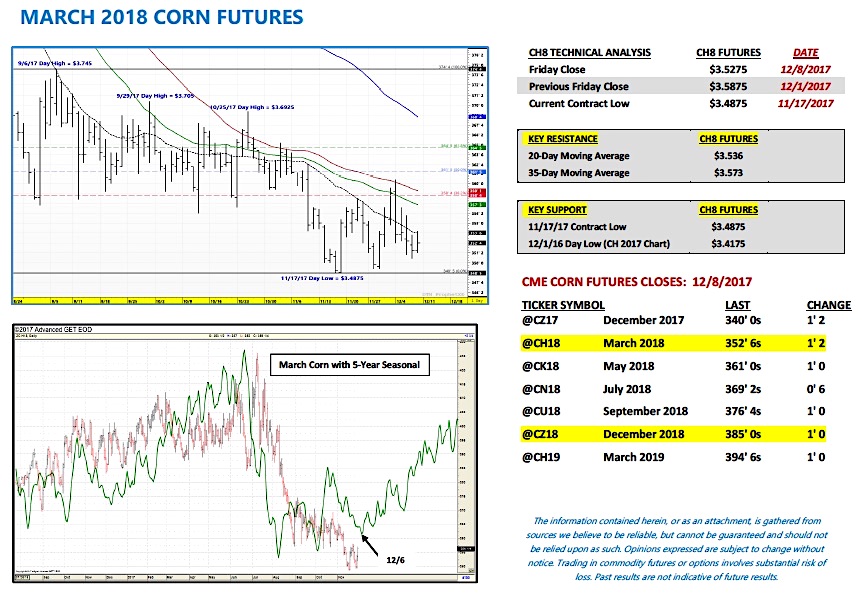
U.S. Corn Futures Weekly Trading Update & Outlook – December 11
U.S. March corn futures closed down 6 cents per bushel week on week, finishing at 3.53.
Bulls still have some breathing room off the lows...
Tax Cut Rally Has Investors Drinking From The Punch Bowl
The term “priced in” is a phrase used frequently by Wall Street and the financial media. This expression is used to describe how much...
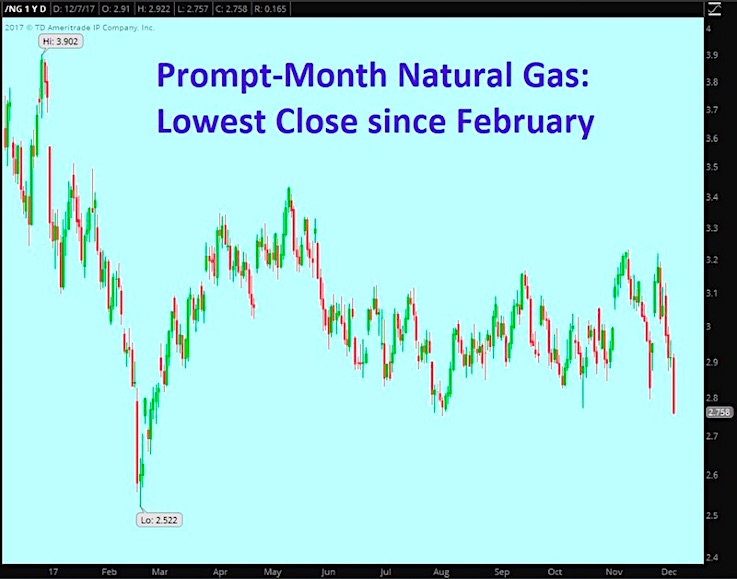
Natural Gas Sees Lowest Close Since February
Prompt-month Natural Gas prices recorded its lowest close since February today. This comes amid milder weather forecasts as holidays approach.
It could be tough sledding...
Corn Futures Weekly Trading Outlook: Relief Rally
U.S. March corn futures are showing some signs of life... but is this simply a relief bounce from oversold conditions?
Prices rose last week, giving...
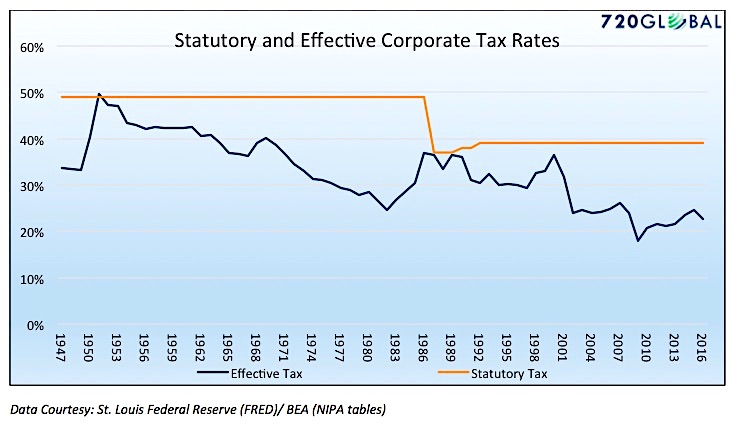
Corporate Tax Cuts: The Seen… and the Unseen
Since Donald Trump was elected President, the S&P 500 (INDEXSP:.INX,) has rallied over 21% or nearly 500 points.
In our opinion, a good portion of...


