Granddad Russell, Grandma Retail and Grand Debt
On August 1st as many cheered the rise in GDP, partly because consumer spending is 70% of the GDP, another agency did not cheer...
Are 10-Year Yields Nearing Historic Breakout To New Highs?
Interest rates remain in the spotlight with investors watching every economic data release and wondering when the Federal Reserve will stop raising rates.
Well, one...
What Does it Take to Build Electronic Vehicle Charging Stations?
Here is a headline from over the weekend:
GM, Other Big Automakers Form EV Charging Joint Venture
Tesla is the dominant player in the EV space....
Gold ETF (GLD): Watch Rising 40-Week Moving Average
Gold remains elevated but is having trouble getting traction with its recent rally attempt.
With a crazy political environment, domestic inflation, and war abroad, one...
$XOP Oil and Gas Exploration & Production ETF Bullish Buy Signal
I remain long (bullish) the Oil and Gas Exploration ETF (XOP) and believe that the current pause is a bullish consolidation.
Furthermore, I also believe...
Precious Metals Gold and Silver Trigger Bullish Trading Signals
It looks like the precious metals are gaining some momentum.
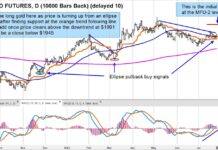
Gold futures put in an ellipse trading buy signal and we see a potential move up...
The Government Can’t Afford Higher Interest Rates For Longer, Much Longer
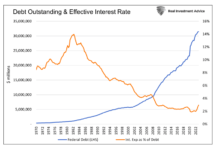
Jerome Powell and his colleagues endlessly reassert their “higher for longer” plan for interest rates. They aim to weaken economic growth, bringing inflation back...
Who Needs Mega-Caps? Blue Chips Q2 Earnings In Focus
The following research was contributed to by Christine Short, VP of Research at Wall Street Horizon.
Sector rotation has been ongoing for the last two...
3 Market Highlights: Netflix, Tesla, and Real Estate Trends
This week we highlight the following market insights:
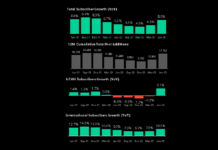
Netflix issues strong report, but average revenue per subscriber left questions. Longer term, the right strategy.
Is Tesla...
3 Stock Market Datapoints (July 16): Instagram, Ads, and Amazon Prime Day
Looking at the week that was as well as the week ahead, I wanted to share 3 important economic datapoints from corporate america (and...


