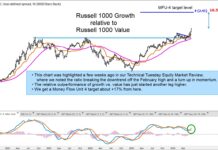
Russell 1000 Growth Index Out-Performing Value; Bullish Trend for Stocks
The mid-to-large cap areas of the stock market continue to move higher in a bullish trend. But not all stocks are on equal footing.
The...
Thoughts On Investment Portfolio Construction For 2024
If the wealth advice service was in the manufacturing industry, the portfolio would be akin to what we make. Sure, there are many value-added...
Golf and Investing: Mastering Long and Short Games For Success
Let’s play a hole of golf to appreciate how two distinct aspects of golf provide valuable lessons for investors.
You tee off with a driver...
Bear Market Signals: Understanding Momentum, Breadth, and Breakdowns
Why do I come off as bearish even when the market is on an upswing?
From a technical analyst’s viewpoint, it's crucial to recognize that...
What Unties the Stock Market’s Gordian Knot?
A Gordian Knot comes from Greece during Alexander the Great’s march.
It has become a metaphor for a problem solvable only by bold action.
Every investor...
Precious Metals: Did Gold, Silver Decline Change Bullish Trend?
While we never profess buying a falling knife, we do believe that the metals are probably setting up for a buyable dip this coming...
Rising Retail Headwinds? Clues from Victoria’s Secret and GameStop Preliminary Earnings
The following research was contributed to by Christine Short, VP of Research at Wall Street Horizon.
April U.S. Retail Sales were below estimates, but other...
4 Retailers Stocks With Outlier Earnings Dates Reporting This Week
The jury’s still out on the health of the US consumer as investors weigh winners and losers of retail earnings season
Outlier earnings dates this...
Understanding the Hindenburg Omen and Its Significance in 2024
Why has the Hindenburg Omen flashed an initial sell signal, and what does it mean for the overall market?
This widely followed macro technical indicator...
Will Tech Stocks Turn Bearish Here?
Technology stocks have continue to lead the broader market higher in 2024, posting new high after new high.
At the same time, this is the...


