S&P 500 Long-Term Bullish, But Here’s Some Pullback Levels To Watch
LONG-TERM TRENDS
The facts we have in hand on Monday, September 24, tell us the market’s long-term trend remains constructive. The charts below show the...
The Stock Market’s Value and Price are at Inflection Point
The market feels like it's nearing an important point in time and price... and price and value.
Let's review our trading levels for Thursday September...
Could This S&P 500 Divergence Lead To Historic Market Correction?
After navigating an early year stock market correction, investors have seen the S&P 500 (NYSEARCA: SPY) climb back to new all-time highs.
While making new...
Is The Metals & Mining Sector Rally Overdone?
The precious metals space has shown particular weakness over the past few months.
That said, precious metals prices have been trading sideways for a month...
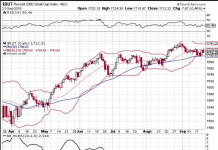
Russell 2000: Tightening Bollinger Bands Signal Trading Opportunity
Bollinger Bands are an excellent technical indicator for traders to watch and use in their trading analysis and execution.
Two charts that caught my eye...
Important Test In Play For Non-U.S. Stock Indexes!
While most global stocks topped at the beginning of 2018, some markets recovered... and some did not.
For instance, the major U.S. stock market indexes...
Gold ETF (GLD): Is A Bollinger Bands Squeeze Nearing?
Bollinger Bands are an excellent technical indicator for traders to keep an eye on.
And right now, they are signaling a potential options trade on...
Futures Trading Update: Can Buyers Scale A Wall Of Worry?
The market's continue to get hit with a barrage of concerning news.
Non-stop news about tariffs, then comes oil production limits, and buzz of increased...
Humana’s Stock (HUM) May Be Nearing A Correction
Humana Inc (NYSE:HUM) has been a strong momentum stock.
But we've seen several momo stocks get hit hard recently. Will Humana fall prey to a correction...
Is Information Overload Hurting Your Investment Results In 2018?
2018 has been a year with a lot of political and financial news, and plenty of stock market bull / bear noise.
This noise makes...


