[VIDEO] What History Is Telling Investors About The Nasdaq Composite
The Nasdaq Composite and tech stocks have been a leader of the bull market.
So it's important to analyze the performance of a market leader...
Stock Market Futures Trading Update: Bulls Rush In
Stock market futures are bouncing off key price support levels from Friday.
News hit the wires this weekend that a NAFTA deal with Canada is...
Weekend Market Update: October Is A Time To Be Selective
The S&P 500 (NYSEARCA:SPY) was flat Friday but its intermediate term posture turned weakly bearish. And small cap stocks aren't helping the market, as...
U.S. Stocks Cruising Just Above Storm Clouds Into October
After a week fraught with news and emotions, the stock market managed to fly above the fray.
Although the S&P 500 (SPY) closed red, it...
Bull Market Cycle Update: Alive But Getting Skinny
Market cycles don’t die of old age, and that is good news as this bull market cycle can only be described as being “rather...
S&P 500 Weekly Outlook: Stay Alert For Market Deterioration
Key Stock Market Takeaways:
New price highs at the index level have come on deteriorating momentum.
Weakening broad market trends and an expansion in the new...
S&P 500 Market Outlook (September 28): Lacking Conviction
S&P 500 Trading Outlook (3-5 Days): No conviction directionally.
The S&P 500 held 2907 and failed to breakdown. That remains a key support level to...
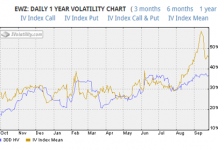
Brazil ETF (EWZ): Using Options To Profit Off Implied Volatility
When implied volatility on the Brazil ETF (NYSEARCA: EWZ) went through the roof earlier in the month, I took notice.
Having previously hovered around the...
15 Current Bull Market Assumptions: Is This Time Different?
If all goes well for nine more months, the post-financial crisis economic expansion will become the longest economic expansion in recent U.S. history.
The U.S....
S&P 500 Long-Term Bullish, But Here’s Some Pullback Levels To Watch
LONG-TERM TRENDS
The facts we have in hand on Monday, September 24, tell us the market’s long-term trend remains constructive. The charts below show the...

![[VIDEO] What History Is Telling Investors About The Nasdaq Composite stock market rally bull standing over bear](https://www.seeitmarket.com/wp-content/uploads/2016/03/stock-market-rally-bull-standing-over-bear.jpg)


