S&P 500 Bull Market Cycle Update: Hanging On!
Let’s do a quick stock market recap. At the beginning of October, 10-year Treasury yields rose above 3.2% while the S&P 500 (NYSEARCA: SPY)...
Are Stocks and Yields Signaling a Broad Market Top Again?
Strong economic cycles often see stocks rise along side interest rates / treasury yields.
A strong economy typically breeds good earnings and higher stock prices.
A...
S&P 500 Technical Update: Is a Tradable Rally Around the Corner?
The price action of the major stock market indices remains ugly and most of my favorite indicators suggest that more rough sledding could lie ahead.
Despite...
Stock Market Trading Update: Will Bulls Come Out Of Hiding?
Yesterday was a nasty down day for the stock market. The selling finally stalled at deep monthly support, before settling into flattening action.
Today marks...
Mary Jane (MJ) Could Help You Escape The Stock Market Blues
The point of today’s Daily is to dissect the daily chart for the Pot ETF - Alternative Harvest ETF (NYSEARCA: MJ).
What made me pay attention...
For Investors, Risk Happens Fast
Just last evening, I shared a chart of the Russell 2000 ETF (NYSEARCA: IWM).
The small cap index was attempting to put in a higher...
Crude Oil ETF (USO) Melted Down Exactly Where It Should
When we posted this warning to crude oil bulls a month ago, the United States Oil Fund (NYSEARCA: USO) had tested and retreated from the...
Does This Look Bullish To You?
Over the weekend, I saw so many bullish tweets about the stock market.
The authors of those tweets shared charts with fancy analysis techniques and...
U.S. Equities Update: Investors Remain Cautious Into Holidays
The S&P 500 (NYSEARCA: SPY), Dow Jones Industrials (NYSEARCA: DIA) and the NASDAQ Composite (NYSEARCA: QQQ) broke a two-week winning streak last week declining...
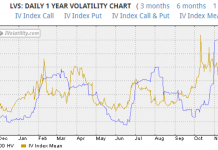
Las Vegas Sands (LVS): Volatility Brings Opportunity for Delta Neutral Traders
Markets have been in correction mode since mid-October, but one stock has been struggling since well before then: Las Vegas Sands (NYSE: LVS).
The stock...


