Q1 2024 Earnings Preview: Will Reports be Good Enough For Stocks?
The following research was contributed to by Christine Short, VP of Research at Wall Street Horizon.
With 2023 in the books and S&P 500 profit...
Gold, CPI and Inflation: Historical Correlations and Analysis
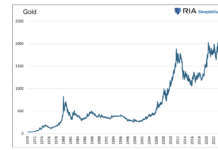
In the face of higher yields, higher dollar, gold has been rallying since early March-and really since October 2023 after the trough.
Although there have...
Is Gold Warning Us Or Running With The Markets?
Having risen by about 40% since last October, Gold is on a moonshot. Many investment professionals consider gold prices to be a macro barometer,...
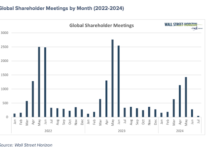
Shareholder Meetings In Focus As Corporate Earnings Season Begins
The following research was contributed to by Christine Short, VP of Research at Wall Street Horizon.
With 2023 in the books and S&P 500 profit...
Tesla and the Future of the Electric Vehicle Market
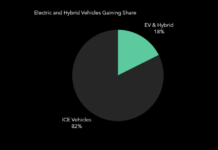
For starters, let's review recent electric vehicle data:
EV's and Hybrids Taking Share: 17.6% of Ql sales hybrid or EVs.
Consumer Survey suggests Hybrids/EV Gaining...
Treasury Bond Yields: Breakout May Test 5% Again
Many investors seem to think that inflation is under control and interest rates are set to decline.
While this may be the longer term play,...
What’s Next For Rangebound Stock Market ETFs?
Watching certain instruments for clues on next moves, probably the best (equities) to watch is the Economic Modern Family of stock market ETFs.
These ETFs...
Is the S&P 500 Flashing a Spring Sell Signal?
The stock market has been red hot over the past 5 months or so with both the S&P 500 and Nasdaq sporting big gains.
But...
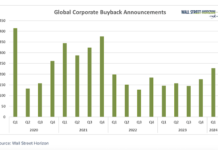
Q1 2024 Buyback and Dividend Increases Point To Improving Corporate Sentiment
The following research was contributed to by Christine Short, VP of Research at Wall Street Horizon.
Last week we shared that CEO sentiment was at its...
All About Tesla’s Musk-Tique
This morning, I made my debut on CNBC’s show Worldwide Exchange with Frank Holland.
Here are the notes I prepared.
At the start of 2024, the...


