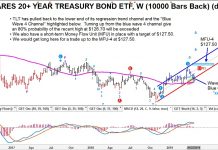
Treasury Bonds (TLT) Reach The Buy Zone For Active Investors
Treasury bonds (NASDAQ: TLT) have been rising in a sideways to higher trend since the stock market bottomed in December.
This is interesting as bonds...
Can Bulls Push S&P 500 Index Past Key Price Level?
S&P 500 Index Trading Outlook (3-5 Days): Bullish
We remain bullish barring a close under 2877. Our upside target 2945-50.
Overall the S&P 500 is now right...
Brazil Stocks ETF May Be Reversing Course (Elliott Wave)
The resistance area we mentioned in January for the Brazilian stocks ETF (NYSEARCA: EWZ) appears to have held.
Now it's time to watch for signs...
Stocks to Bonds Ratio Shifts: What It Means for Investors
WEEKLY CCI
The commodity channel index (CCI) can be used to identify rare and extreme shifts in investor conviction. From stockcharts.com:
In general, CCI measures the...
The Great Stock Buyback Bonanza Continues Into 2019
This article is by Bill Nasgovitz, Chairman and portfolio manager.
Egged on by record levels of repurchases, as shown above, politicians have been quick to...
Investors Succumbing to Animal Spirits (Research Update)
If you ever want to study human psychology, the capital markets may be one of the best windows into the mind.
Markets move based...
U.S. Equities Analysis Shows Technicals At Odds With Fundamentals
The U.S. equity markets continue to grind higher encouraged by recent economic data, including strong retail sales, a vibrant labor market and a high...
Stock Market Today: Big Week of Corporate Earnings
A quiet start to the week is likely as traders return from the long holiday weekend.
The stock market is hovering new all-time highs and...
U.S. Equities Looking For Pause That Refreshes
U.S. Financial Market Highlights:
Inflation may put pressure on the Federal Reserve.
Economic gains are being broadly distributed.
S&P 500 earnings expectations reset may not be complete...
S&P 500 Index Fibonacci Price Target: 3048
Following the financial crisis, it took the stock market a handful of years to make new all-time highs again.
In fact, it wasn't until 2013...


