Why Active Investors Should Follow Junk Bonds
Bonds issued by companies with a credit rating of BB or lower by S&P or Fitch, or Ba or lower by Moody's, are considered junk...
Treasury Bonds Nearing “Bounce” Buying Opportunity (Elliott Wave)
If you made use of the Elliott wave support area we identified in our October post, then you probably caught a good trade in treasury...
Magnificent 7 Stocks To Report Earnings During S&P 500 Selloff
The following research was contributed to by Christine Short, VP of Research at Wall Street Horizon.
Markets continue their downward momentum despite a positive start...
Is Largest Rally In 10 Year US Treasury Bond Yield History Nearing End?
US Treasury bond yields have been moving higher for the past 4 years.
Furthermore, the rally marks the largest 200 week rally in 10-year yield...
Investor Caution As Market Rotates from Growth to Value
For consistency’s sake, this is the 3rd weekend in a row I am showing you the weekly charts of the Economic Modern Family ETFs.
3 weeks...
Are Semiconductors (SMH) Rolling Over At Key Fibonacci Level?
We often talk about leadership. Stocks that are leading the market higher. Sectors that are leading the market higher. Indices that are leading the...
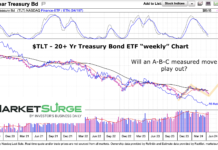
Are Treasury Bonds Ready To Follow A-B-C Correction Pattern?
The treasury bond market continues to captivate the minds of active investors as the focus on interest rates (and the Federal Reserve) continues.
If bonds...
Is the United States On Japan’s Path of Stagnation?
We recently wrote Japan’s Lost Decades to appreciate better why Japan’s GDP is smaller than it was in 1995 and why it took 35 years for...
Two Consumer Stocks With Unusual Earnings Reporting Dates
The following research was contributed to by Christine Short, VP of Research at Wall Street Horizon.
March CPI data was not what the bulls wanted...
Tech Stocks Struggling At Double Top Fibonacci Resistance!
Technology stocks have been the engine behind the stock market rally into 2024. Even better stated, tech stocks have been a market leader since...


