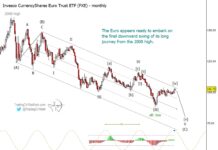
The Euro’s Likeliest Path is Downward (Elliott wave forecast)
The Euro has remained in a consolidation zone since we last wrote about it in April, but we think nearby resistance will be difficult to...
Financial Sector Fallout? The Federal Reserve Interest Rate Decision
The following research was contributed to by Christine Short, VP of Research at Wall Street Horizon.Borrowers face significant challenges, so says the CFO of...
Stock Market Risk Gauges Provide Technical Insights
Every week we review the big picture of the market's technical condition as seen through the lens of our Big View data charts.
For Technical...
Market Update: Invest In Economics, Not Politics
I enjoy sharing with you, my new and devoted readers, the notes I send out to media producers.
In this case, I share my notes...
Gold Bugs Index (HUI) Rides Bull Market Trends Higher
As gold prices continue to climb higher in 2024, so do the prices of gold stocks and gold miners.
And it appears that the gold...
Are Bank Stocks Sending A Warning To Investors?
Our economy and financial markets rely on a well-functioning banking industry.
And just as we saw with the Financial Crisis in 2008, things can go...
Stock Splits Continue 2024 Comeback
The following research was contributed to by Christine Short, VP of Research at Wall Street Horizon.
Stock splits are gaining in popularity in 2024 as...
Treasury Bonds ETF (TLT): Bullish Elliott wave Opportunity on All Time Frames
The current environment for treasury bonds remains favorable for upward trades in the near term, with the biggest consideration being the time frame that...
Gold Bull Market Awaiting Bullish Confirmation Signal
The past 50 years have seen gold prices trading up and down but within a rising trend channel.
Several things impact the price of gold,...
Biotech Sector ETF Struggling at Key Price Resistance
The stock market has turned higher and investors are looking for winners.
In short, winners are stocks or sectors that are in an up-trend or...


