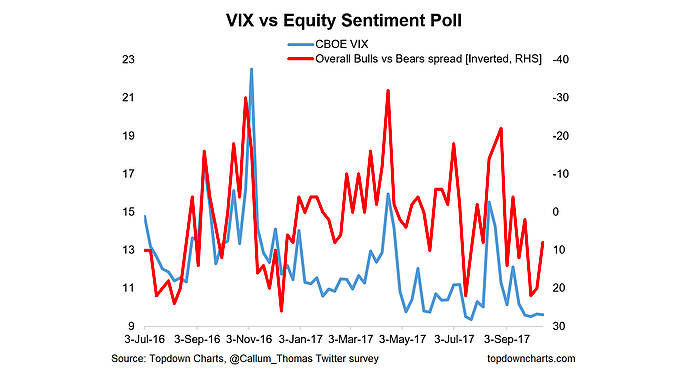
Weekly Investor Sentiment Survey Points To Higher Volatility
This article reviews the data from the latest weekly sentiment survey I conduct over on Twitter.
The survey measures respondents' equity and bond positioning/view - differentiating between whether the...
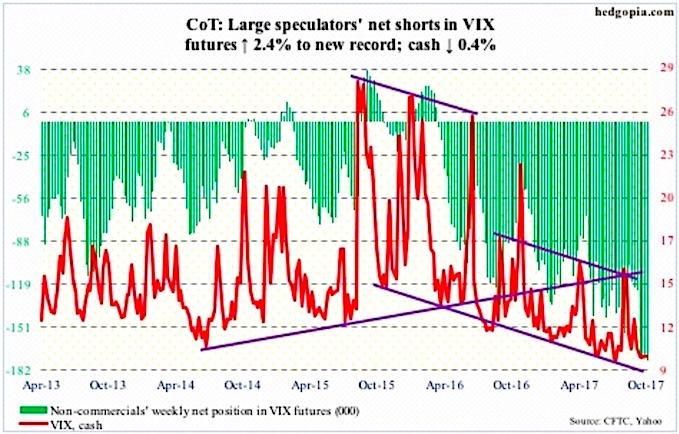
COT Report: Non-Commercials Long $SPY, Very Short $VIX
The following are charts and data showing non-commercial futures trading positions as of October 10, 2017.
This data was released with the October 13 Commitment...
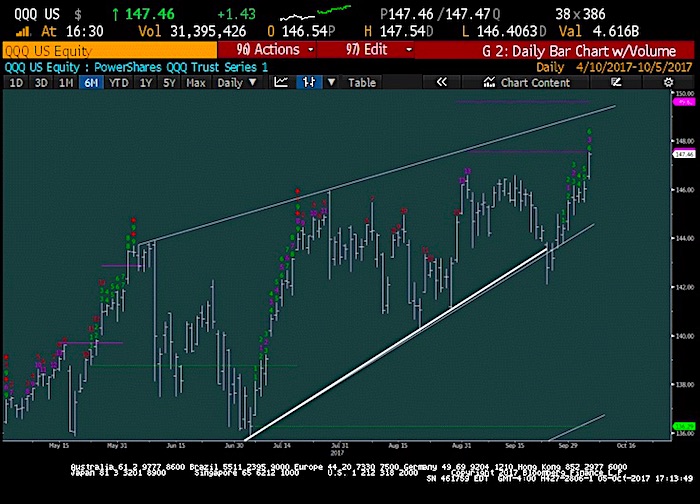
Stock Market Trading Update: Prepare For Volatility
S&P 500 Trading Outlook (2-3 Days): BEARISH
Short-term market top looks near. And an uptick in volatility (INDEXCBOE:VIX) could be on the way next week.
There’s...
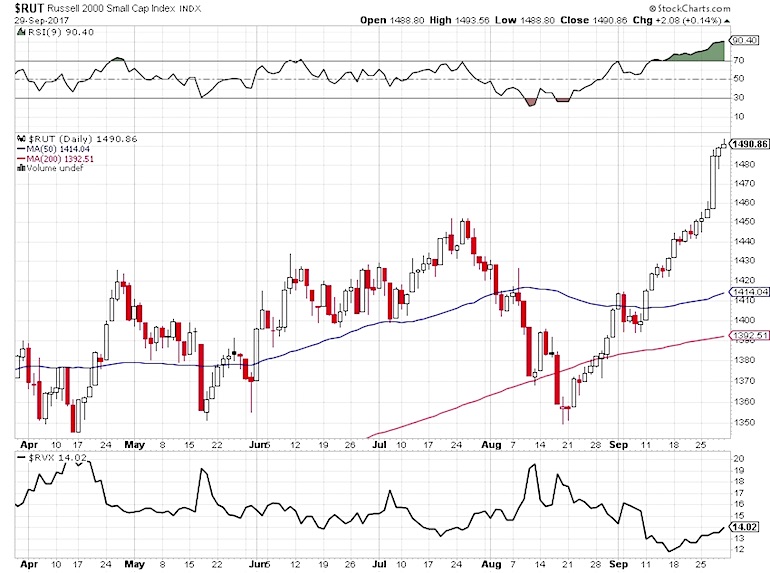
Using RVX Small Cap Volatility Index to Time Your RUT Entries
With the Russell 2000 index (INDEXRUSSELL:RUT) sitting at record highs, many traders are wondering how much longer it can continue to climb without a...
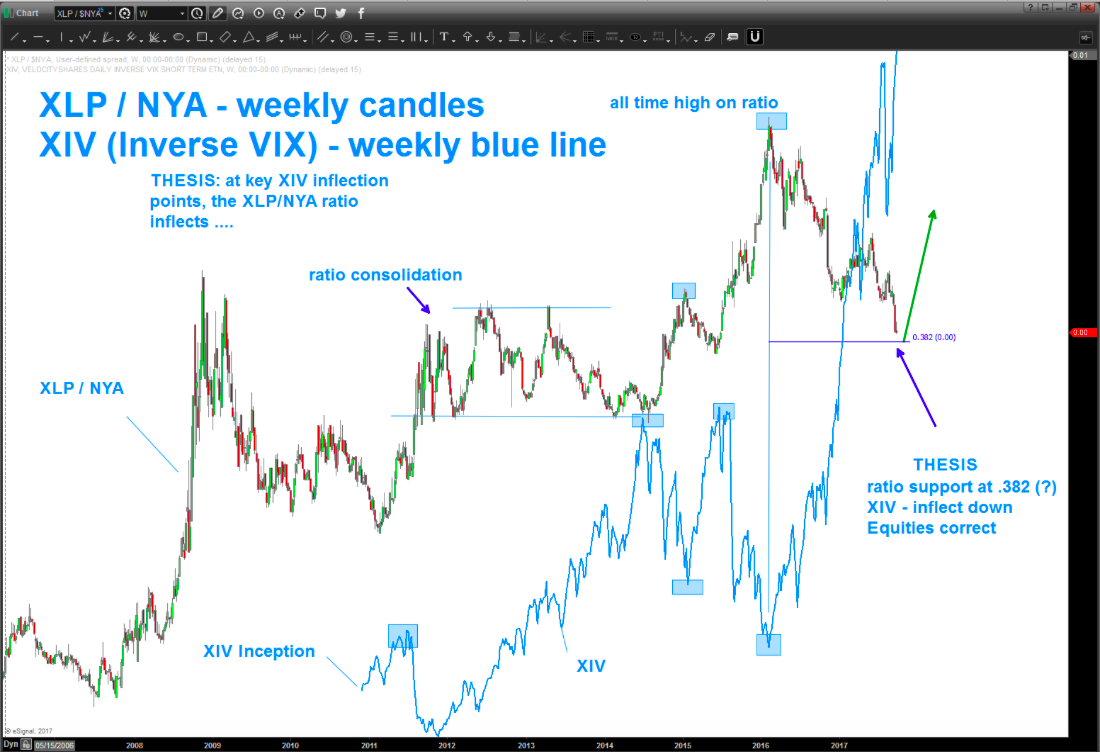
Are Consumer Staples Signaling A Volatility Omen?
Will October see a volatility spike?
We've been trading in extremely low volatility for some time... so this is a fair question. Especially because one...
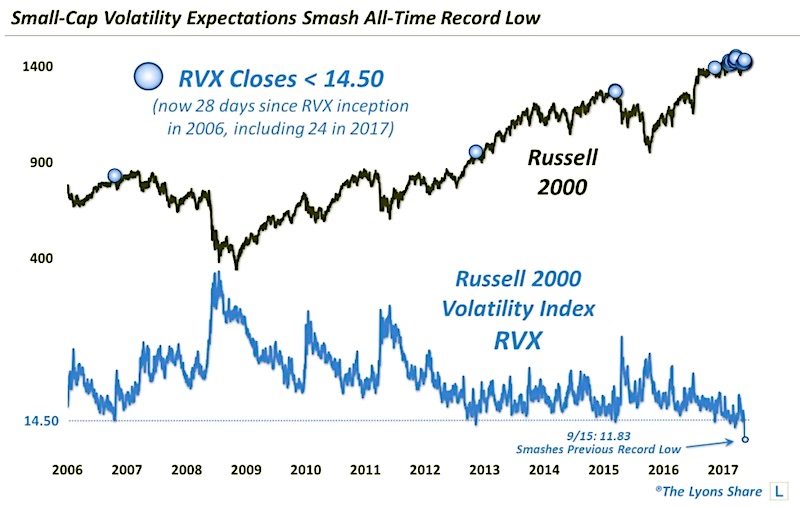
Russell 2000 Volatility Index Hits Record Lows: Trouble Ahead?
Small-Cap volatility expectations just smashed previous record lows.
I’ve written a fair amount lately on various themes related to volatility expectations in the stock market.
Many...
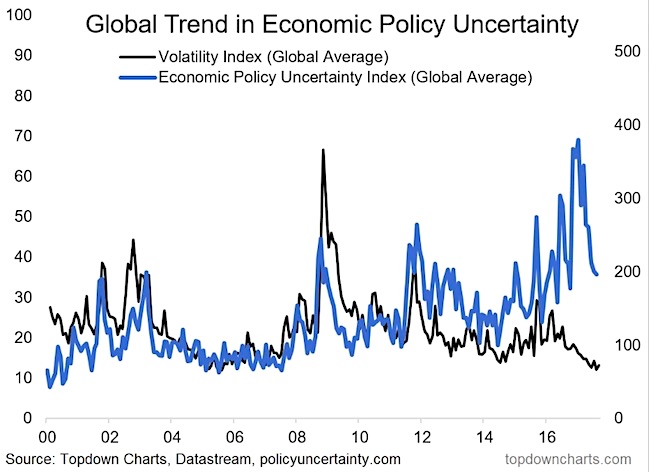
Is Market Uncertainty Showing Signs Of Complacency?
There are several ways to process, measure, and analyze market uncertainty.
Today we'll look at two charts that show investors uncertainty through different lenses: One...
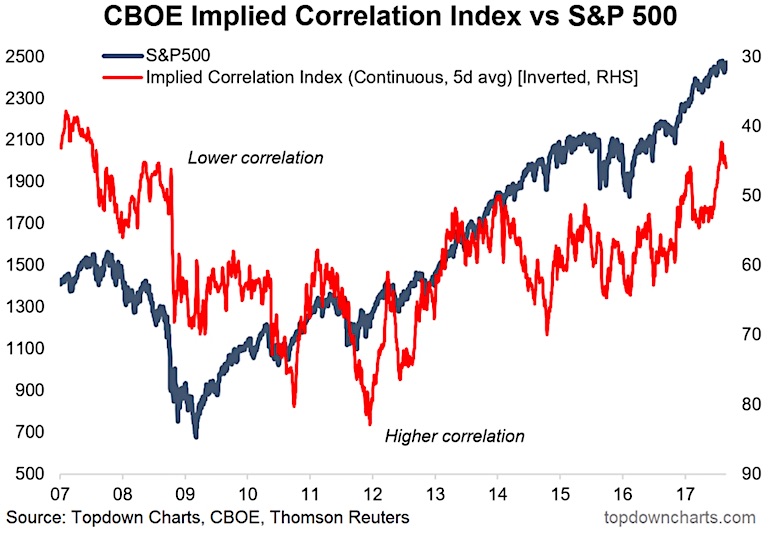
CBOE Implied Correlation Index Highlights Rising Risks For Investors
In this article we take another look at a somewhat obscure indicator "implied correlations".
The Implied Correlation Index comes from the CBOE and is a...
Stocks Rebound But Volatility Shakes Investor Confidence
The equity markets rallied last week breaking a two-week losing streak. The S&P 500 (INDEXSP:.INX) and Dow Jones Industrials (INDEXDJX:.DJI) gained 0.7% while the...
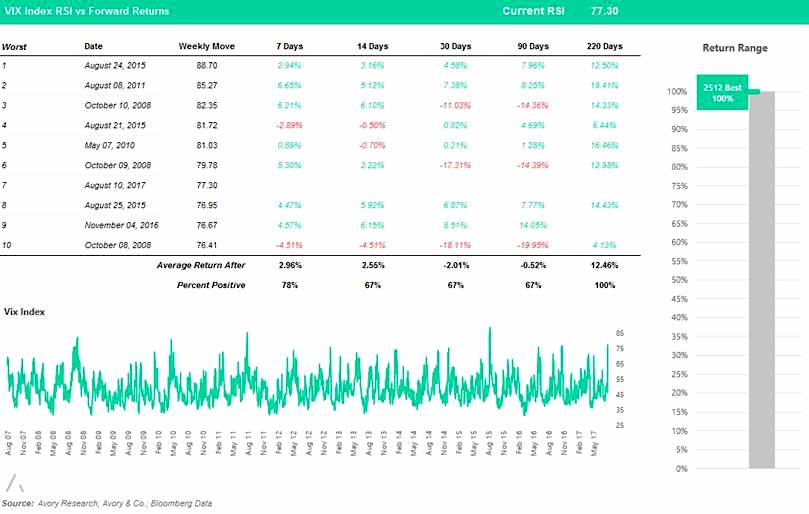
Stock Market Volatility Index (VIX) Surges as RSI Tops 80
After periods of extreme complacency, we are often met with times of severe reversals.
This has been the case for the VIX Volatility Index ()...

