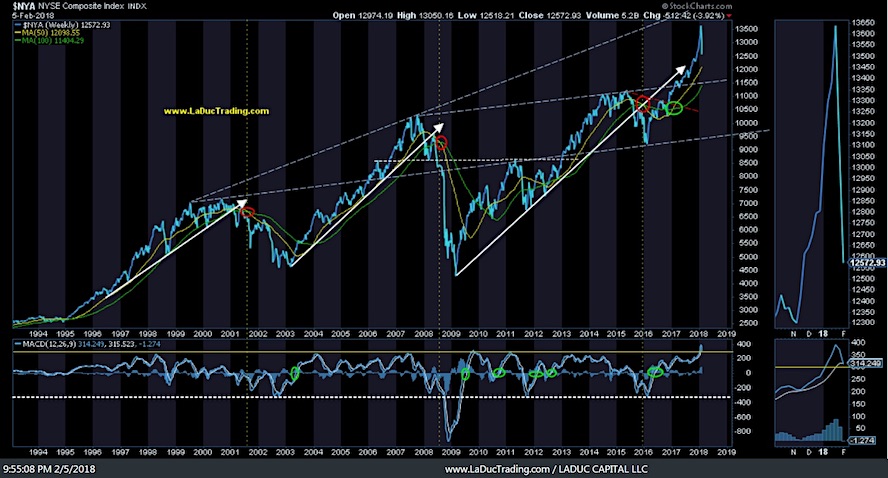
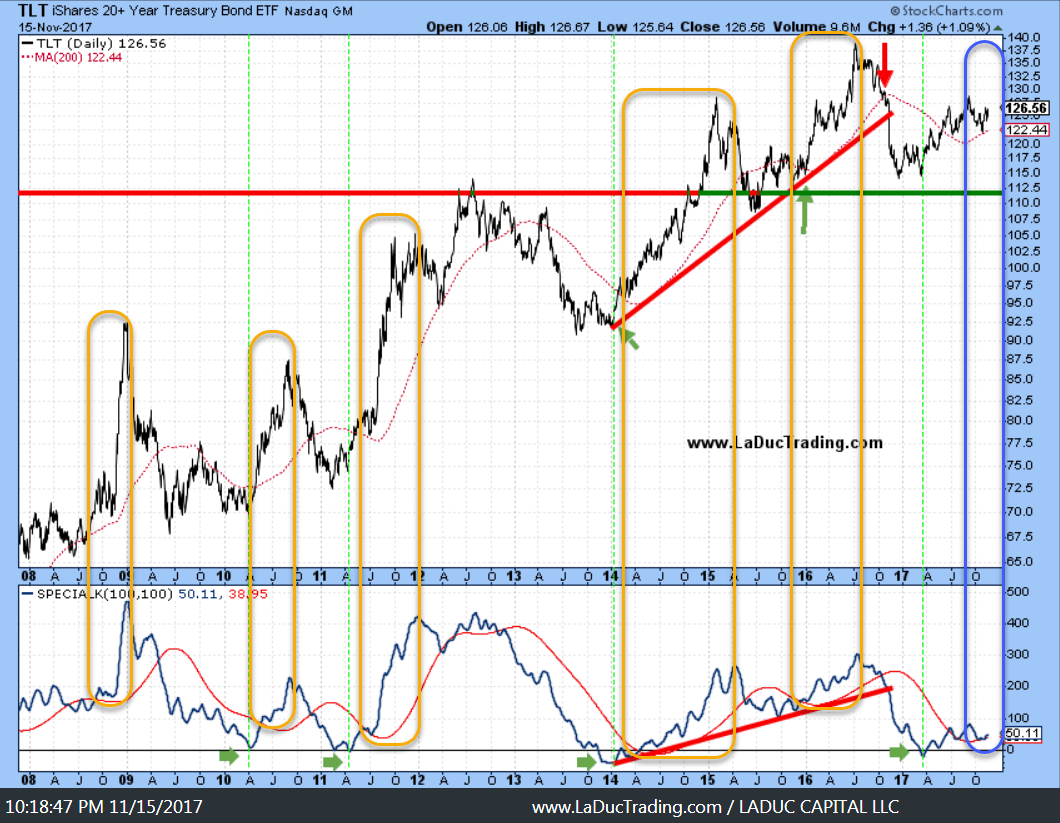
Intermarket Chart Attack: Not Done
This is an Intermarket Analysis chart review that I provided to my fishing club members this past weekend which graphically represents relationships (strong and weak) that can...
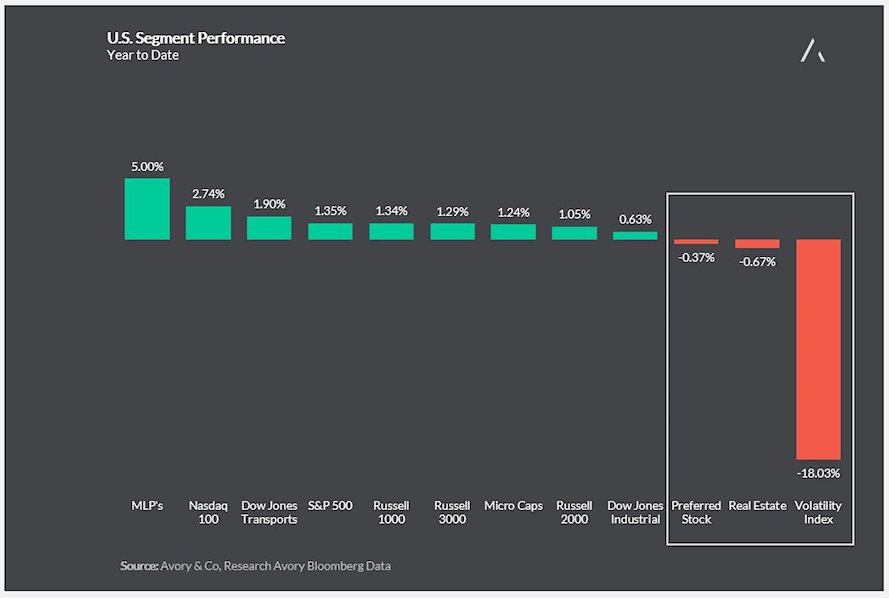
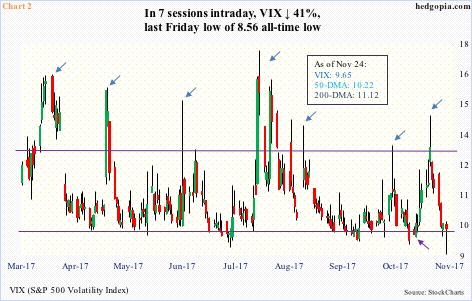
Chart Spotlight: Volatility Sinks To Start 2018
Investors read a lot about the persistence of low volatility in the markets throughout 2017.
And just 3 trading days into 2018 and volatility is...
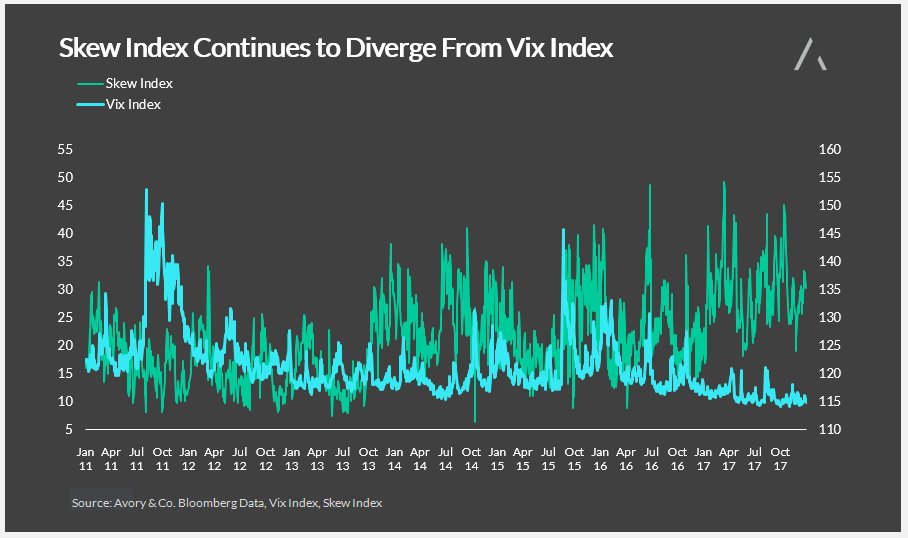
SKEW Index Continues To Diverge From VIX Index
The story of volatility has been very one-sided of late. There’s been low volatility despite various geopolitical headlines which in the past would have...
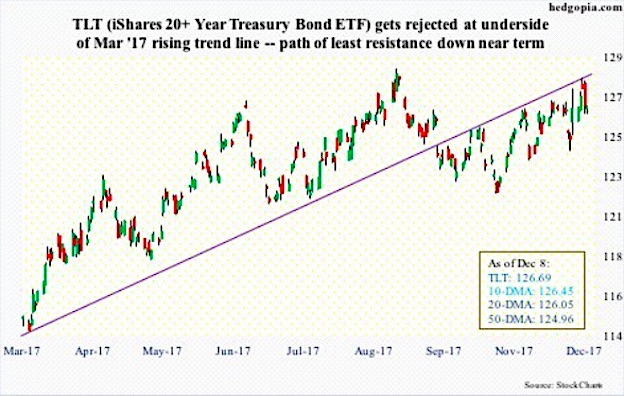
Options Trade Idea: $TLT Treasury ETF Credit Call Spread
Last Wednesday, iShares 20+ year Treasury bond ETF (TLT) got rejected at the underside of a broken trend line from March this year. The...
Volatility Metrics Calling For A Breather For Stocks
Major U.S. stock market indices rallied to fresh new highs last week. Even small-caps, which until recently had been lagging their large-cap brethren, joined...
How To Trade An Iron Condor
An Iron Condor is an options trading strategy where the seller of the Iron condor is looking for the price of the underlying security...
Pockets Of Forced Selling Highlight Risks For Investors
There are pockets of forced selling taking place in the global markets, and I find it curious that these different asset classes are politely...
Is Volatility A Good Predictor Of Financial Bubbles?
The Answer May Surprise You...
Market volatility has been a hot topic this year, largely due to its historic lack of activity while staying at...
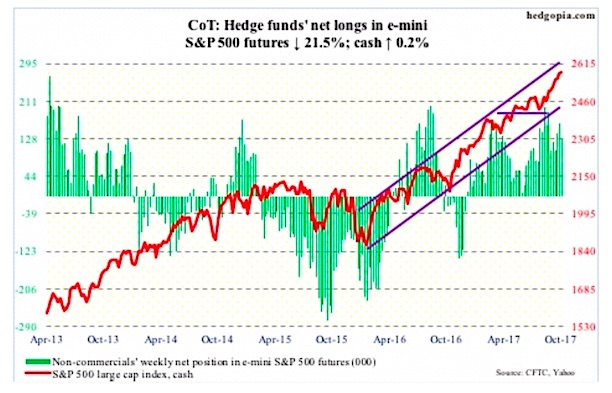
COT Report: Are Speculative Traders Hinting At A Sharp Move?
The following are charts and data showing non-commercial futures trading positions as of October 24, 2017.
This data was released with the October 27 Commitment...
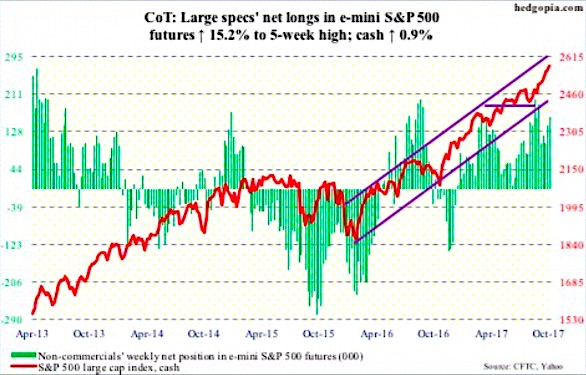
The COT Report: Equity Bulls Show Their Horns
The following are charts and data showing non-commercial futures trading positions as of October 17, 2017.
This data was released with the October 20 Commitment...

