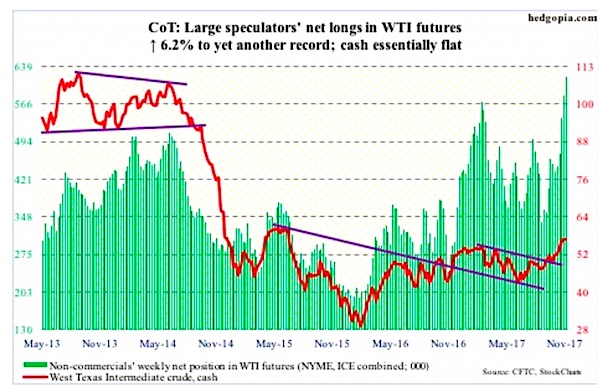
COT Report Spec Positioning: Record Net Longs In Crude Oil
The following are charts and data showing non-commercial futures trading positions as of November 14, 2017.
This data was released with the October 17 Commitment...
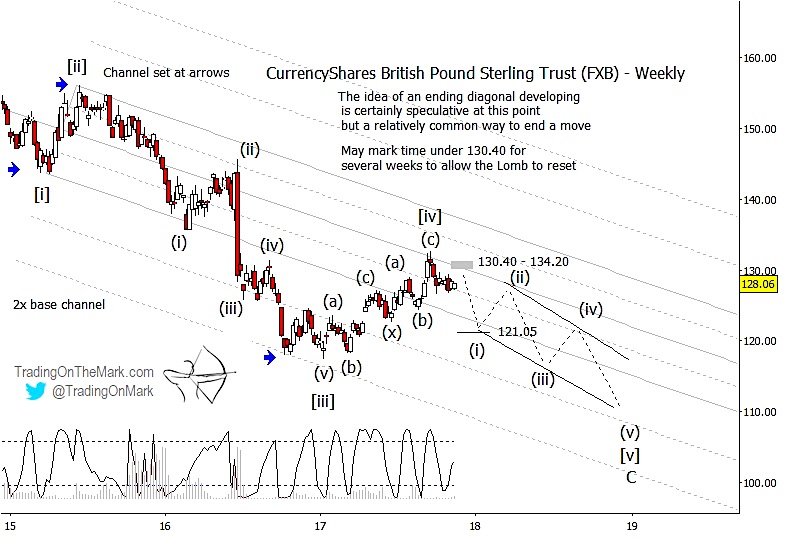
British Pound Decline Set For Another Wave Lower
As the U.S. Dollar spent the past several years working upward in an impulsive wave, so too has the British Pound (CURRENCY:GBP) cross been...
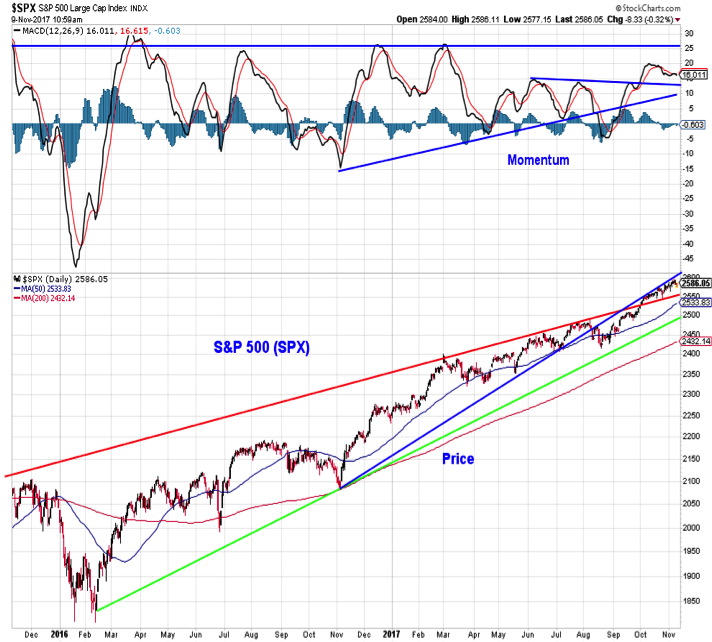
S&P 500 Weekly Market Outlook: The Rally Is Out Of Sync
In this week’s investing research outlook, we examine current trends for the S&P 500 Index (INDEXSP:.INX) and Russell 2000 (INDEXRUSSELL:RUT), while checking in on stock market breadth and...
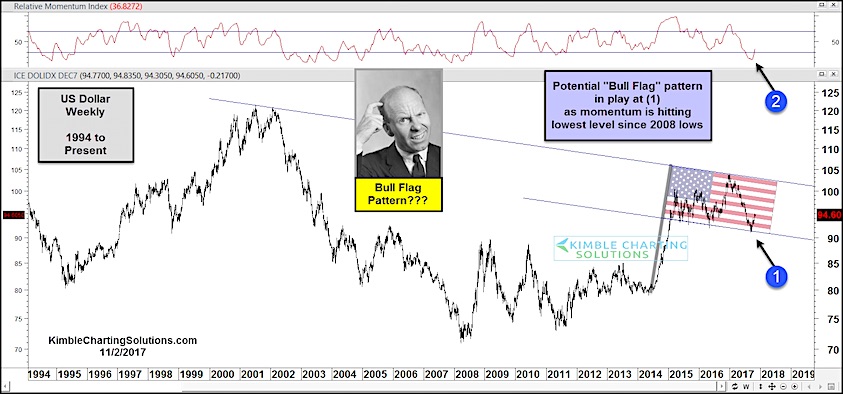
Is The US Dollar Forming A Long-Term Bullish Flag Pattern?
This past year has seen the US Dollar Index (CURRENCY:USD) slide nearly 10 percent. And this action has brought out the Dollar bears.
But could...
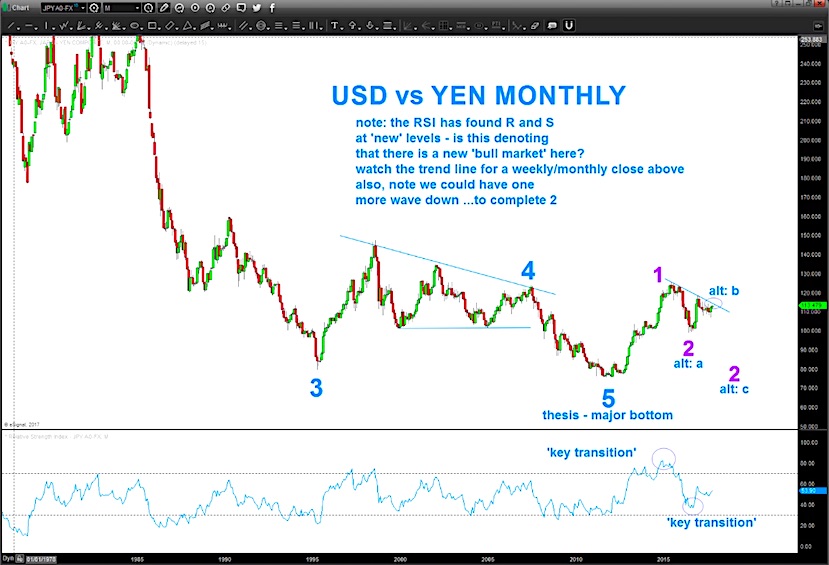
USD/JPY Currency Chart: Is Elliott Wave 2 Over?
I've been watching the US Dollar Index (CURRENCY:USD) and Japanese Yen (CURRENCY:JPY) for many years. And I've had several trading run-ins with the USD/JPY.
Those...
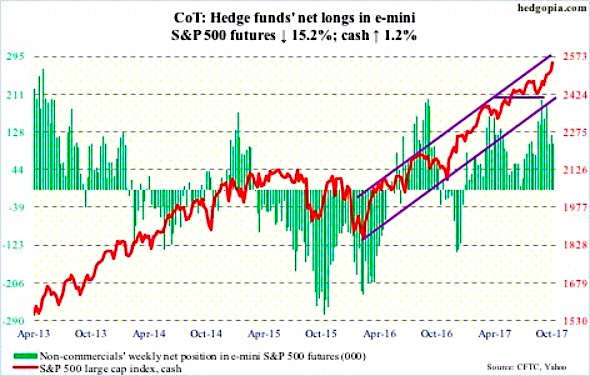
The COT Report: Stocks Overheating, Gold Oversold
The following are charts and data showing non-commercial futures trading positions as of October 3, 2017.
This data was released with the October 6 Commitment...
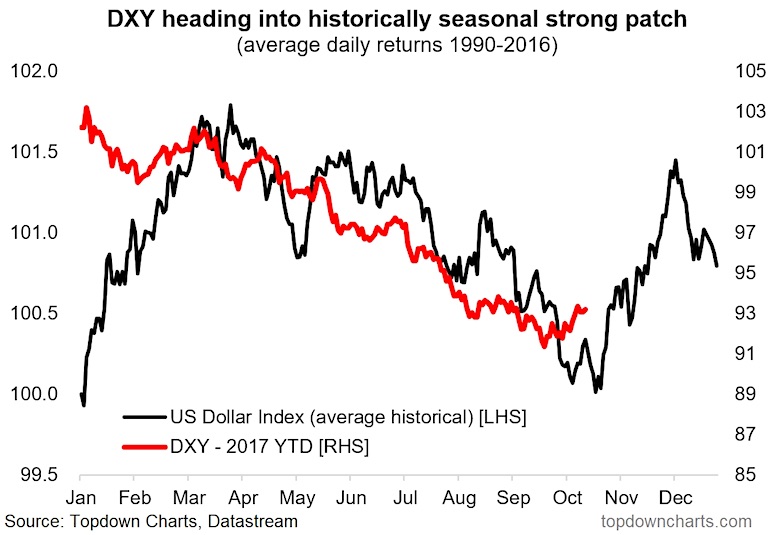
A Seasonal Second Wind For The U.S. Dollar?
In this article we look at a couple of key potential catalysts that will shape the tactical view on the US Dollar Index (CURRENCY:USD)...
Stock Market Update: One More Push Higher?
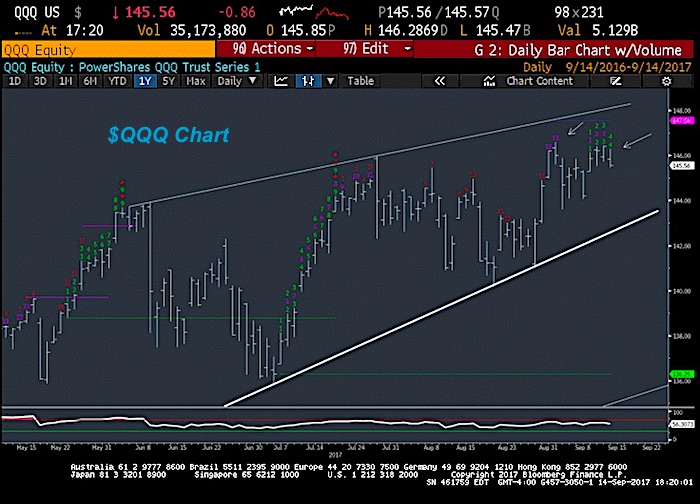
Stock market futures traded up near yesterday's highs this morning, a sign that bulls are defending the bears attempts at lower prices.
That said, the...
Bitcoin Bounces As Bulls Look To Regain Momentum
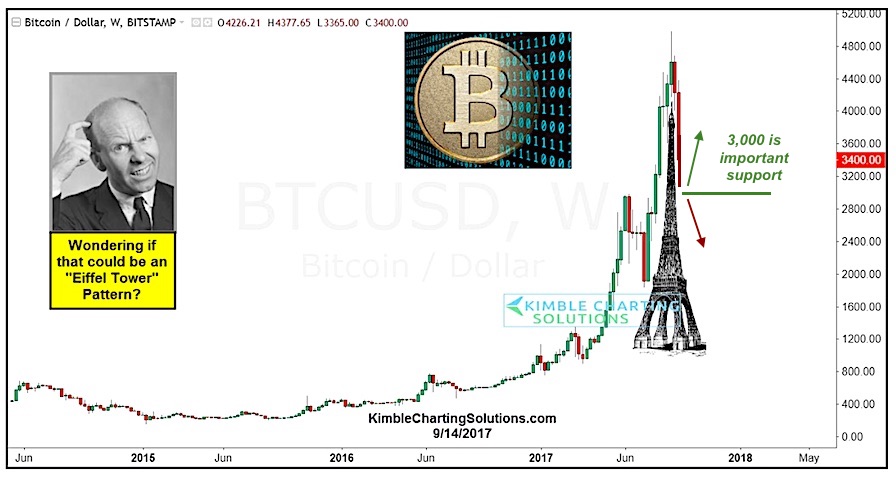
Bitcoin peaked earlier this month around $4,950... but last week was brutal for short-term bull traders.
A slight slip in early September gave way to...
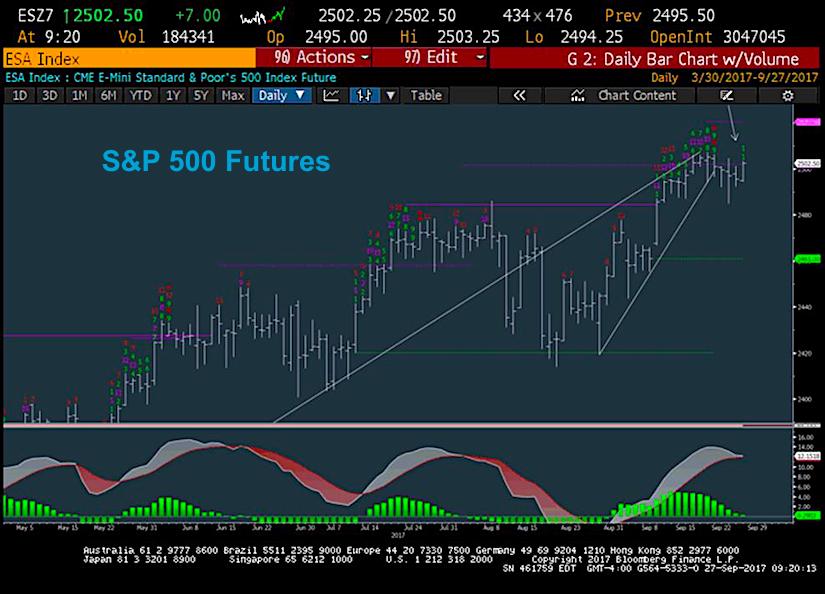
U.S. Equities Trading Update: Upside Limited
S&P 500 Outlook (2-3 Days): BEARISH
Upside is likely limited into Expiration as the rally stalls.
There's been no change in thinking given lack of movement here...

