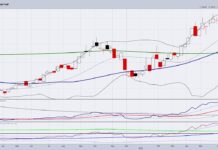
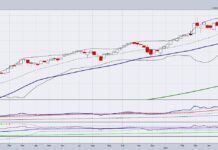
Energy Sector (XLE) and Stocks Bullish, Price Targets Higher
We follow the energy sector very closely and have been bullish for some time. Of course as an active investor you need the tools...
Can Gold and Silver Hold Recent Price Gains?
As impressive as the global stock rally was last week, gold and silver's remarkable performance on Friday did not generate many financial headlines.
Still, their...
Natural Gas Dislocation: Fundamentals Versus Price Analysis
Global demand for natural gas continues to skyrocket in the wake of Russia's invasion of Ukraine.
Over the last year, demand for LNG has risen...
Is The Rally In Commodities Prices Reversing Course?
The past several weeks have seen many commodities take a breather from their near vertical ascent.
This is welcome news for many consumers that have...
What Can Investors Expect From Oil Price Market?
U.S. crude oil continues to rise after a pullback late last week to around the mid-$90s per barrel.
However, the price is hitting short-term resistance...
Oil Stocks Counter-Trend Rally Over If Price Reversal Sticks!
For over 2 years, all crude oil prices did was go higher... and higher. And consumers have been feeling this pain as the gas...
Are Gold And Silver Ready for A Momentum Breakout?
Although we are watching for another step up in the major indices, we are also looking at safety plays in commodities.
Specifically looking at precious...
Bullish Pattern Could Send Gold Prices Much Higher!
Gold prices and precious metals bulls have been biding their time.
While gold has traded sideways-to-lower, bullish investors have simple sat tight, waiting for a...
Is Crude Oil Gearing Up for a Big Move?
The country has been under pressure from rising gas prices for months.
Even before the Ukraine war, gas was steadily increasing.
While the U.S continues to...
Why We are Focusing on Commodities Over Equities
Tuesday, the Nasdaq 100 (QQQ) outperformed the other indexes ending the day +1.20%, while other major indices closed roughly flat on the day.
From the...


