Gold or Rubles? A Pickle Worth Exploring
Financial sanctions weighing on Russia are sending up red flags around the globe. The seizing of Russian foreign reserves and eliminating access to SWIFT...
Commodities ETF Forms Wedge Pattern, Big Move Coming?
Commodities came into March like a lion and went out like a lamb.
Even so, the price of several commodities remains elevated and pressuring an...
If Australian Dollar Breaks Out, Commodities May Scream Higher!
Over the past 11 years, the Australian Dollar has been in a downtrend. Today's chart highlights its falling channel marked by each (1).
Could we...
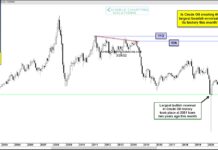
Is Crude Oil Creating Historic Bearish Price Reversal?
The Ides of March are in full effect. Investors have been rocked by war, inflation, and financial markets volatility.
At the center of all of...
Are Steel Prices On Cusp of a Major Breakout?
Over the past several months, we've shared a lot of commodities charts and highlighted the economic theme of inflation.
Well, inflation is here. Now...
U.S. Stock Market Indices Navigating Commodities Surge
The major stock market indices ended the trading week on a weak note with the Russell 2000 (IWM) and the Nasdaq 100 (QQQ) closing...
Could Peak Oil Be Happening Right Now?
Crude oil prices (and everything else) started rising with COVID and supply chain issues. And now that we are adding sanctions on Russia and...
Commodity Price Index Near Most Overbought Level In 45 Years!
The CRB Commodity Index has rallied sharply over the past 2 years.
And although the index is not near all-time highs, it is getting stretched...
Crude Oil Overbought, Elliott Wave Points To Pullback
It's hard to score profits by trading on news headlines, and the current environment makes it even harder. We prefer to rely mainly on...
Precious Metals “Cup” Patterns Have Long-Term Bulls Excited!
Each investor has to be aware of what their time-frame is. Are we looking at the coming days, weeks, months, or years. Some are...


