US Dollar Rally Reaches Pivotal Long-Term Resistance!
Six years ago, the Economist magazine illustrated the mighty US Dollar. And that marked a peak that has since been tested but not broken out...
Key Stock Market ETFs Battling Price Resistance
We continue to use Mish’s economic Modern Family of stock market ETFs to successfully navigate through the pandemic, as well as to provide insights...
Are Steel Prices On Cusp of a Major Breakout?
Over the past several months, we've shared a lot of commodities charts and highlighted the economic theme of inflation.
Well, inflation is here. Now...
Best Potential Trade Setup Looking Ahead: FXE Euro Trust
As Forrest typically writes the Daily commentary, and quite well I might add, today please consider me a guest host to my own blog.
As...
Presenting the Bullish Elliott Wave Case for the S&P 500 Index
In our late January post about the S&P 500 Index, we said the expected top was probably in place. Recent price action has caused us to...
Can Major Stock Market Indices Hold 50-Day Moving Average?
After the quarter-percent rate increase, the market continues to rally off recent lows.
Now all the major indices besides the Nasdaq 100 (QQQ) have cleared...
Is Gold Miners ETF (GDX) Headed Back Up Over $40?
At the beginning of March, we shared a buy setup for the Gold Miners ETF (GDX) and that trade worked out quite well.
Today, we...
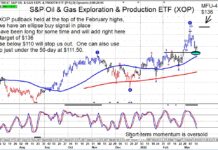
Crude Oil and Energy Stocks, ETF (XOP) Heading Higher
We are not expecting crude oil or energy stocks to rally in a straight line up, but we are off to a good start.
The charts...
Is Amazon Stock Price Repeating 2018 Bottoming Pattern?
The decline in Amazon's stock price over the past several months has been an important event for investors.
Let's face it, Amazon (AMZN) is one...
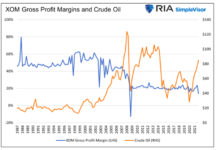
Big Oil and The Fallacy of a Windfall Profits Tax
Higher energy prices worrying you? Be afraid because Congress is coming to the rescue. Legislators are introducing a new bill called the “Big Oil...


